
Back
#Cloud Performance
OTT Platform Engineering in India: What the 821-Million-Viewer Stream Taught Us

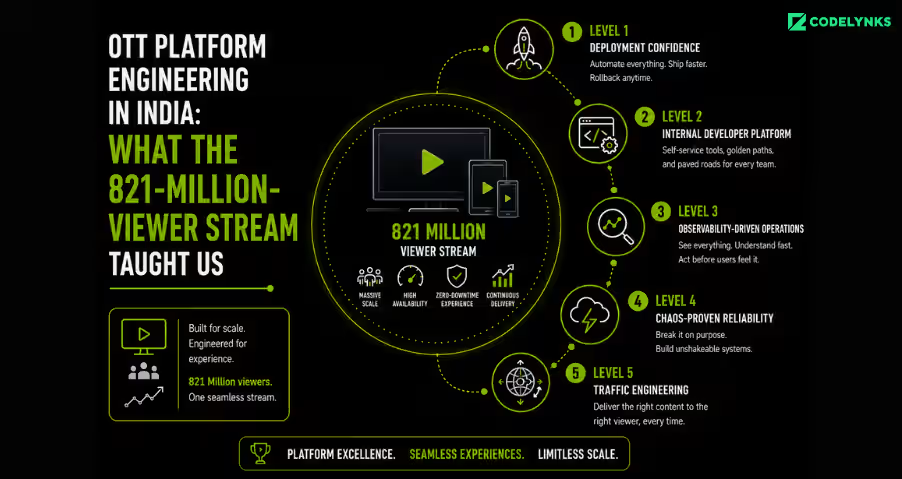
Table of Contents
OTT Platform Engineering in India: What the 821-Million-Viewer Stream Taught Us
On March 8, 2026, JioHotstar delivered a live stream to 821 million simultaneous viewers during the ICC T20 World Cup final. The engineering post-mortems published by the team describe 800+ microservices, HTTP/3 and QUIC protocol deployment for last-mile optimization, multi-cloud load shedding across AWS, GCP, and Azure, and edge-based personalization running at a continental scale.
For a regional South Indian language OTT platform we work with 8 million MAU before their acquisition into a larger streaming group the story prompted an uncomfortable question from their CTO: “Could our platform handle our own equivalent peak event?” The answer, after a week of investigation, was no. Not because of CDN capacity. Because of a misconfigured API gateway rate limit that would have started dropping requests at 12,000 concurrent viewers.
JioHotstar’s engineering story is real and significant. It is also not a reference architecture for the other 50 Indian OTT platforms that collectively serve 400 million users. The engineering principles it reveals, platform maturity, observability, and API gateway reliability apply at every scale. The specific implementation does not.
What the JioHotstar Benchmark Actually Tells Operators
The 821-million-concurrent number is the headline. The engineering substance is in the supporting details. During the India vs England semi-final on March 5, JioHotstar recorded 65.2 million peak concurrent viewers then described as the highest live event concurrency ever achieved on any digital platform. Three days later, they pushed it to 821 million.
The infrastructure to achieve this: adaptive bitrate orchestration with per-viewer quality ladders, QUIC-based transport for loss-tolerant delivery on mobile networks, real-time CDN selection based on performance telemetry, and a multi-cloud architecture that allows traffic migration between providers during live events.
JioHotstar’s 821-million viewer stream was a technology story. For everyone else, the lesson is about platform engineering foundations and whether their platform would survive their own equivalent peak.
The equivalent peak for a regional language OTT platform is not 821 million. It is the release of a major film, a state election night, or a regional sports final events that create 40x to 60x normal traffic spikes within a 10-minute window. The platform engineering question is the same: is your deployment infrastructure, API gateway configuration, and observability stack designed for that spike profile, or for your average Tuesday evening traffic?
The Platform Engineering Gap in Indian OTT
Most Indian OTT platforms below 30 million MAU operate without a formal internal developer platform. The consequences compound over time:
Deployment cadence slows as services accumulate. Without a golden path for service creation standardized templates, environment provisioning, pipeline configuration each new service inherits a bespoke deployment approach. By the time a platform has 20 services, no two are deployed the same way. A configuration change that should take 30 minutes takes 3 days because the pipeline for that specific service is undocumented.
Observability is reactive rather than proactive. Teams learn about failures from subscriber social media posts, not from dashboards. RED metrics (request rate, error rate, duration) are not instrumented for all services. Correlation between service failures and CDN-level symptoms is manual and slow.
On-call burden concentrates on a few engineers. The “platform” is a person, not a system. When that person is unavailable, the team’s operational capability degrades substantially. There are no runbooks. There is institutional knowledge.
Post-acquisition platforms inherit the worst version of this: two incompatible CI/CD systems, two observability stacks, and two on-call rotations that need to merge into one without dropping operational coverage during the integration period.
The Streaming Platform Delivery Maturity Model (SPDMM)
Platform engineering maturity for OTT operations has five levels:
Level 1: Deployment Confidence. Every service has a deployment runbook. Rollback to the previous version takes under 10 minutes and is tested quarterly, not theorized. Deployment success is observable there is a dashboard that confirms a deployment completed without errors and traffic is flowing normally. This sounds basic. Most platforms below 10 million MAU do not pass this level for all services.
Level 2: Internal Developer Platform. A golden path exists for creating new services: templates for service scaffolding, one-click environment provisioning, deployment pipelines that require no bespoke configuration per service, and a service catalog that teams use as the source of truth. The IDP does not need to be built on Backstage with a full plugin ecosystem. It needs to answer one question for every engineer: “How do I deploy this safely?”
Level 3: Observability-Driven Operations. RED metrics are instrumented for every service in the streaming critical path manifest delivery, DRM key exchange, player initialization, and concurrent session management. Alerting fires before viewer impact: the alert threshold for error rate on manifest requests triggers at 2%, not when social media reports buffering. On-call runbooks cover the 10 most common failure scenarios with automated triage steps.
Level 4: Chaos-Proven Reliability. Quarterly chaos experiments run against production-like environments. Regional failover is tested under synthetic load before it is needed under real load. Synthetic monitoring generates viewer-perspective traffic 24/7 and alerts on quality degradation that would be imperceptible in aggregate metrics but visible to the affected viewer segment.
Level 5: Traffic Engineering. Adaptive load shedding during traffic spikes non-critical API calls (recommendation updates, social features) deprioritized automatically when origin capacity crosses 80%. Real-time CDN selection based on per-PoP performance telemetry. Content steering that routes live event traffic to the highest-performance delivery path within 500ms of a CDN performance degradation. This level requires significant instrumentation and automation investment, and is appropriate for platforms above 50 million MAU with live event dependence.
The Internal Developer Platform for OTT Teams
An IDP for an OTT platform with 15 to 40 engineers does not need enterprise complexity. It needs four capabilities:
A service catalog that lists every service, its owner, its deployment pipeline, its alert contacts, and its runbook. Backstage works. A Confluence page with a defined schema works. What does not work is the knowledge existing only in Slack thread history.
Deployment pipeline templates that handle the OTT-specific cases: blue-green deployment for streaming services (you cannot take manifest delivery offline during a rollout), canary release for player code changes (progressive rollout to 5% of sessions before full release), and rollback that preserves session state for active viewers.
Environment provisioning that lets engineers spin up a staging environment with realistic traffic simulation not a staging environment that has never seen concurrent sessions above 100. Load testing against a staging environment that does not simulate real bitrate ladder switching is not useful.
An observability onboarding template so that every new service starts with RED metrics, structured logging, and trace correlation wired in not added as a post-launch improvement when the first incident reveals the gap.
Indian OTT operators should not use JioHotstar’s architecture as a reference design. The architecture that handles 821 million concurrent viewers requires 800+ microservices and three cloud providers to operate. For a platform serving 10 million MAU, that complexity is an operational liability, not a reliability feature. The right reference architecture is one that your team can understand, operate, and fix at 2 AM during a live event.
The Failure Mode No One Talks About
Most OTT streaming failures are attributed to CDN issues. Most are not CDN issues.
The actual failure mode: viewer experience degrades. CDN dashboards show normal cache hit rates and origin fetch latency. The CDN is delivering what it has. The problem is that the API gateway upstream of the CDN started dropping requests manifest requests, player initialization calls, DRM key exchange under traffic volumes that were not anticipated in the rate limit configuration.
An OTT platform that discovers a failure from subscriber complaints has already lost the window to fix it without viewer impact.
The API gateway is the most under-instrumented component in every OTT stack we audit. It is also the most likely single point of failure during a live event.
The specific pattern: media manifest and player initialization requests spike 40x to 60x in the first 90 seconds of a live event as viewers join simultaneously. API gateway rate limits configured for average traffic patterns not peak event burst patterns start dropping requests at a fraction of the peak. The CDN cannot help because the problem is upstream.
The fix is not a bigger CDN budget. It is: separate rate limit profiles for live event traffic vs. VOD traffic, implemented in the API gateway, tested with load simulation that replicates the join curve of a live event launch, and documented in the on-call runbook for live events.
What This Means for Media and Entertainment Leaders
Three tests to run this week, without external help:
Can your team deploy a configuration change to your API gateway and roll it back within 15 minutes? If this requires manual steps that are not documented, you are operating without a safety net during live events.
Pull your API gateway logs from the last live event or traffic peak and check for 429 (rate limit exceeded) or 503 (service unavailable) responses. If 429 responses appear in the first few minutes of a traffic spike, the rate limit is misconfigured for your actual burst pattern.
Check your RED metrics instrumentation. Does your team have a dashboard showing error rate and latency for manifest delivery right now not after you build it next quarter? If the answer is no, observability is a gap before the next peak event, not after.
Platform engineering maturity is not a vanity investment in tooling. It is the operational foundation that determines whether your platform survives the traffic event you planned for, and the one you did not.
More Blogs: Future-Proof OTA Cloud Architecture: Build for AI Agents in 2026



