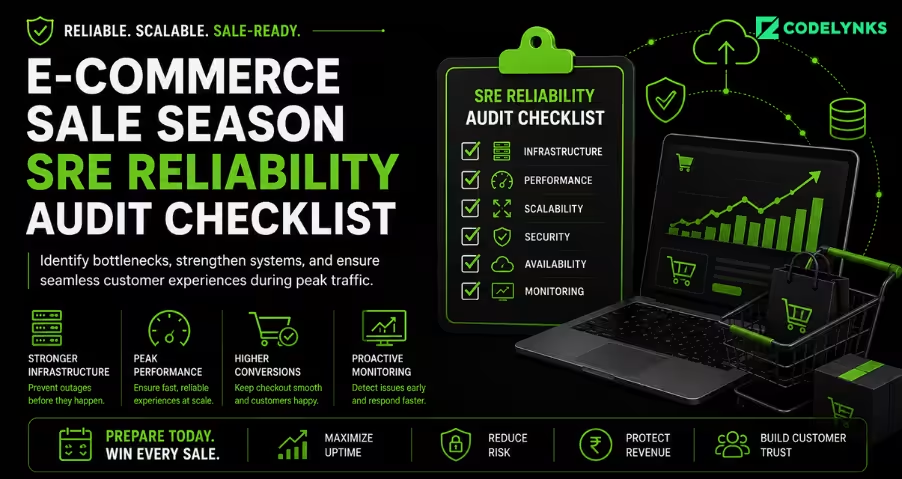
E-commerce Sale Season SRE Reliability Audit Checklist Items

E-commerce Sale Season SRE Reliability Audit Checklist for Flash Sale Readiness and Peak Traffic Performance

Introduction: E-commerce Sale Season SRE Reliability Audit Checklist

The E-commerce Sale Season SRE Reliability Audit Checklist helps retailers identify infrastructure bottlenecks before major flash sale events. By auditing database capacity, payment gateways, inventory systems, and CDN performance, teams can improve reliability and prevent revenue-impacting outages.

The problem is not whether your platform will receive peak traffic. The problem is whether you have found your bottlenecks before the traffic finds them.We work with a mid-market Indian D2C brand in fashion and home décor with 2 million monthly active users and three annual flash sale events. Before their first Diwali sale, their infrastructure team had scaled the application tier to handle 15x traffic. On sale day, the checkout success rate at peak was 38%.

The application servers were sitting at 40% CPU utilization. The bottleneck was the database connection pool provisioned for their normal daily load, unchanged since the platform was built in 2023, which was exhausted within the first four minutes of peak traffic. Every checkout attempt that could not acquire a connection timed out silently. The orders were lost, not queued.

This is the pattern that repeats across Indian e-commerce every sale season. The bottleneck that kills a flash sale is almost never where the team was looking.

How to Use an E-commerce Sale Season SRE Reliability Audit Checklist Before Flash Sales

Not all peak failures look the same. Six failure modes account for the majority of Indian e-commerce outages during high-traffic sale events:

Database connection pool exhaustion. Application tier autoscaling adds more application instances. Each new instance opens connections to the database. The connection pool limit often a default set at deployment is hit when the number of application instances multiplied by per-instance connection count exceeds the database maximum. Writes start failing. Checkout breaks. Application servers report as healthy.

Inventory reservation race conditions. When 500 users add the same low-stock item to cart simultaneously, the inventory reservation logic that worked fine under normal load starts producing oversell. The fix database-level row locking or a Redis-backed reservation cache must be designed before the sale, not patched during it. Issuing cancellations to customers who completed checkout is a brand problem, not a database problem.

Payment gateway saturation. Your payment gateway SLA covers availability, not throughput. A 99.9% uptime guarantee does not specify response behavior when 40,000 concurrent checkout requests arrive within two minutes. Indian payment gateways Razorpay, PayU, Cashfree, Paytm each have throughput limits that vary by account tier and time of day. Platforms that have never tested their gateway at peak load discover these limits on sale day.

Notification pipeline backup. Order confirmation emails, SMS OTPs, and WhatsApp notifications are processed through queues. Under normal load, queue lag is milliseconds. Under flash sale load, the notification queue can back up by minutes or hours, causing customers to experience delayed confirmations and triggering support escalations that overwhelm the team during the event.

CDN cache miss storm: Sale launches involve new promotional assets banners, sale pricing, updated product pages that often bypass CDN cache due to aggressive cache invalidation at launch time. The origin server receives direct traffic for assets that would normally be served from cache. If the origin is not sized for direct asset traffic at peak, page load times spike and conversion rates fall.

Third-party script failures. Analytics tags, A/B testing scripts, chat widgets, and loyalty program widgets are synchronous or semi-synchronous JavaScript that loads on every page. When any one of them degrades under load their own servers overwhelmed by your spike it can block page rendering or break checkout flows in ways that are nearly impossible to diagnose in real time.

The Pre-Peak SRE Readiness Scorecard (PPRS)

Six dimensions, assessed nine weeks before the sale date and again three weeks before. Any red dimension at the three-week mark requires immediate engineering action or a sale scope reduction.

Dimension 1 Connection Pool and Database Capacity. Audit the configured connection pool limit for every database in your transaction path: primary RDS or PostgreSQL, Redis, and any third-party databases. Calculate the maximum connection count at your projected peak application instance count. Add 20% headroom. If the calculation exceeds the database maximum connections, you have a problem to solve before autoscaling is configured.

Dimension 2 Inventory Reservation Architecture. Test the concurrent add-to-cart and checkout flow at 10x, 20x, and 50x your normal peak concurrency. Count oversell events in the test run. If any oversell is produced, the reservation architecture needs a fix before the sale. Acceptable solutions: database-level optimistic locking with retry, Redis-backed atomic reservation with TTL, or a dedicated inventory reservation service with a queue.

Dimension 3 Payment Gateway Load Testing. Contact your primary payment gateway and request throughput documentation for your account tier. Then run a load test at 120% of that throughput limit using a synthetic checkout flow (test card numbers, real gateway sandbox). Measure error rate and response time. If the error rate exceeds 1% at this load level, discuss throughput tier upgrades with the gateway or add a secondary gateway as a fallback.

Dimension 4 Notification Pipeline Capacity. Calculate the expected notification volume for the first 30 minutes of the sale: order confirmations, OTPs, WhatsApp messages. Check your current queue throughput against that projected volume. If queue throughput is less than twice the projected volume, the pipeline will back up. Configure queue scaling policies to pre-provision workers before the sale, not reactively after the backup is detected.

Dimension 5 CDN and Asset Strategy. Create a pre-warming plan for all sale assets: promotional banners, updated product pages, new category landing pages. Cache-warm these assets on the CDN at least 2 hours before sale launch, not at launch time. Set cache TTLs on sale assets to a minimum of 15 minutes. Aggressive invalidation at launch time is the most common cause of origin server overload at sale start.

Dimension 6 Third-Party Script Audit. List every third-party JavaScript loaded on your product pages and checkout flow. For each: confirm it loads asynchronously. If any script loads synchronously in the page head, evaluate whether it can be deferred. For scripts that cannot be deferred, test the page behavior if the script endpoint is unavailable (simulate with a browser network block). Checkout must complete even when analytics or chat scripts are unavailable.

“Every outage during a flash sale is a planning failure, not a technical failure.”

Chaos Engineering Before the Sale, Not After the Outage

The most reliable platforms run targeted chaos experiments in the 4 to 6 weeks before a major sale. Not full-system chaos surgical fault injection against the specific failure modes listed above.

Chaos test 1: kill 30% of application instances during a sustained load test. Verify autoscaling brings them back within your defined recovery time, and that the database connection pool does not saturate during the scale-out period.

Chaos test 2: inject a 2-second latency on your primary payment gateway endpoint during load testing. Confirm the checkout flow fails gracefully, routes to the secondary gateway, and returns an accurate error message (not a generic 500) to the customer.

Chaos test 3: pause the notification queue workers for 10 minutes during load testing. Confirm messages queue correctly, no messages are dropped, and consumers catch up within 15 minutes of workers resuming. This validates your queue backpressure handling.

The counterintuitive chaos engineering finding: the chaos test that produces the most unexpected results is almost always Dimension 6. Third-party scripts fail in ways that are not captured in monitoring dashboards, because the failure is on the client side in the browser. Browser-side chaos testing blocking specific third-party domains in a realistic browser environment reveals script dependencies that nobody documented. Run a 10-minute load test at 5x your normal peak using tools like k6 or Locust.

What This Means for E-commerce Leaders

August is nine weeks away. The Big Billion Days follow in October. If you are running a Diwali sale, the preparation window for that event is also now the engineering debt that causes Diwali outages is visible in the August sale if you know where to look.

Three things you can do this week without engaging Codelynks:

First, pull your current database maximum connections configuration and your application instance autoscaling policy. Calculate the maximum connection count at peak instance count. Compare it to the database limit. Do this calculation today, before any other preparation work, because it is the highest-impact single number in your peak reliability posture.

Second, run a 10-minute load test at 5x your normal peak using a tool like k6 or Locust against your checkout flow. Do not stop at application-tier metrics. Pull database connection utilization during the test. If utilization exceeds 70% at 5x load, you will hit the limit before 20x.

Third, check whether your payment gateway account has a throughput limit below what you expect to see on sale day. Most platforms have never asked this question. The answer is in the gateway’s developer documentation or your account manager’s standard rate limits. If you cannot find it, open a support ticket asking for your account’s peak TPS limit. Get the answer in writing before August.

Conclusion

An E-commerce Sale Season SRE Reliability Audit Checklist should be reviewed before every major flash sale event. The E-commerce Sale Season SRE Reliability Audit Checklist helps teams validate database capacity, payment gateway readiness, inventory reservation systems, and CDN performance. By following an E-commerce Sale Season SRE Reliability Audit Checklist, retailers can reduce outages and improve checkout reliability during peak traffic periods.

More Blogs: e-commerce-sale-season-sre-reliability-audit-checklist

LLM Clinical Documentation India: Production Checklist

Introduction: LLM Clinical Documentation India Explained

LLM Clinical Documentation India is becoming a strategic priority for hospitals, healthcare networks, and digital health platforms. As AI medical scribes gain adoption across India, healthcare organizations must move beyond pilot projects and build production-ready clinical documentation systems that integrate with EMRs, ABDM infrastructure, and hospital workflows.

The problem is that compelling pilot results are not the same as production deployments. We work with a multi-specialty hospital chain in South India, 12 facilities, approximately 4,000 OPD visits daily across nine specialties. When we reviewed their clinical AI deployment plan, the model evaluation process was thorough. The integration architecture was not. Six months of pilot success had produced a system that worked for one doctor, in one language, connected to one EMR instance, with no monitoring, no retraining trigger, and no doctor-in-the-loop escalation path. That is a demo, not a production system.

This post covers the five architectural stages that separate a clinical LLM pilot from a production deployment, why the integration layer is where most Indian hospital implementations break, and the framework we use to assess readiness before go-live. LLM Clinical Documentation India is rapidly evolving from pilot projects to production deployments across hospitals, healthcare networks, and digital health platforms.

Why EkaScribe’s Architecture Matters Beyond EkaScribe

The design decisions Eka Care made in building Parrotlet reveal the engineering requirements for any clinical LLM in India. Parrotlet a-en-5b is trained specifically on Indian medical speech; it knows drug brand names sold in India, understands code-switching between English and regional languages, and handles the clinical shorthand that trained Western models miss. The v2 release adds real-time Hindi and Indian English transcription at clinical-grade accuracy.

Three things Parrotlet’s architecture communicates to the market:

First, generic ASR models fail in Indian OPD settings. AWS Transcribe Medical and Google Speech-to-Text are trained predominantly on Western clinical speech. Code-switching between Tamil and English, or Marathi and English, breaks their word error rates at the clinical threshold. Any Indian hospital deploying a clinical LLM on top of a generic ASR layer is building on sand.

Second, safety validation is non-negotiable. EkaScribe’s production stack includes localized training data, RAG-based processing against medical knowledge bases, secondary LLM review of generated notes, and a doctor-review gate before any note is finalized. The doctor-in-the-loop design is not a regulatory hedge. It is the only architecture that sustains clinician trust past the first month.

Third, EMR integration is the hard part. A clinical LLM that produces a note as a PDF for manual re-entry into the EMR is not a documentation tool. It is an extra step. The value is in structured output that maps to the EMR’s field schema: chief complaint, history, examination, diagnosis with ICD-10 or ICD-11 codes, prescription with Indian brand names, and follow-up instructions. Getting that mapping right for HL7 FHIR against a legacy hospital information system is a 6 to 10 week integration project.

The future of LLM Clinical Documentation India depends on secure healthcare data access, ABDM integration, and clinically validated AI workflows.

ABDM Is the Competitive Moat Nobody Is Building For:

The Ayushman Bharat Digital Mission’s Unified Health Interface (UHI) and Health Facility Registry give clinical LLMs access to something no Western model has: longitudinal Indian patient records at population scale. An ABDM-linked clinical LLM can retrieve a patient’s prior visit records from other facilities before the current consultation, pull existing diagnoses and medications, and flag drug-drug interactions in the context of the patient’s actual history.

“ABDM is not a compliance checkbox. It is the only path to training a clinical LLM on Indian disease profiles at the scale needed to make it defensible.”

Most hospital IT teams treat ABDM integration as a compliance task: generate ABHA IDs, link health records, check the box. The engineering opportunity is different. ABDM’s longitudinal records, structured under FHIR R4, are the training substrate for fine-tuning clinical LLMs on Indian disease presentations, comorbidity patterns, and prescription practices. A model fine-tuned on ABDM-consented records from Indian patients outperforms any imported foundation model on Indian clinical tasks. That fine-tuning advantage compounds over time. It is the defensible moat.

The counterintuitive finding from our work: ABDM integration latency is the primary production bottleneck for most clinical AI features, not model inference time. ABDM API response times under load average 800ms to 1.4 seconds. A clinical LLM pipeline waiting on ABDM record retrieval before generating the note will feel slow to the doctor.

The fix is pre-fetching patient records at check-in, not at consultation start. A successful LLM Clinical Documentation India strategy requires much more than model accuracy. Integration, monitoring, and governance determine long-term success.

The Clinical LLM Production Readiness Checklist (CLPRC)

Five stages, each with a binary pass/fail gate before advancing to the next.

Stage 1: ASR Validation. Test your chosen ASR model against a sample of 200 real consultation recordings from your OPDs, across the languages and specialty vocabularies you need to support. Minimum acceptable word error rate for clinical use: below 8% for medical terminology. If you cannot pass Stage 1 with your chosen model, stop and re-evaluate ASR before building the LLM layer.

Stage 2: Structured Output Mapping. Map the LLM’s output schema to every field in your EMR that the note will populate. Build the connector. Test round-trips with 50 synthetic cases. If the EMR requires manual correction of more than 15% of fields across the test set, the output mapping is not production-ready.

Stage 3: Doctor-in-the-Loop Design. Define the escalation path for low-confidence outputs. Every clinical LLM should produce a confidence score or flag ambiguous sections. Build the UI for doctor review: a single-screen diff showing the AI-generated note against the patient record, with one-click accept, one-click modify, and mandatory acknowledge before note finalization. Measure review time. If review adds more than 90 seconds per consultation on average, the workflow has failed.

Stage 4: ABDM Integration and Pre-fetch. Connect to ABDM for patient record retrieval. Implement pre-fetch at check-in, not at consultation trigger. Test under realistic concurrent load for your peak OPD hours. Define fallback behavior when ABDM is unavailable (build with graceful degradation, not hard dependency).

Stage 5: Monitoring and Drift Detection.  Define your production quality metrics: weekly word error rate on a sample of flagged notes, EMR field acceptance rate (unmodified accepts divided by total notes), and doctor satisfaction score on a 2-question weekly pulse. Set retraining triggers. A model whose EMR acceptance rate drops below 75% in any two-week window should trigger a retraining evaluation, not a support ticket.

Where Indian Deployments Break Down in Months 2 to 6

Pilot success creates a specific risk: the pilot doctor is self-selected, motivated, and working with the vendor’s support team on hand. Production deployment removes all three of those conditions simultaneously.

The failure modes we see most often:

Language mix at scale. A pilot validated for English-speaking specialists breaks when rolled out to the general medicine OPD where conversations are 60% regional language. Stage 1 ASR validation must cover every language and code-switching pattern in your facility, not just the pilot specialty.

EMR version drift. Hospital EMR updates change field schemas. The clinical LLM’s output mapping silently starts failing after an EMR patch. This goes undetected for weeks because doctors quietly correct the errors rather than reporting them. Build automated output validation that alerts when field acceptance rates drop.

No retraining budget. The model was trained on data from 18 months ago. New drug formulations, updated clinical guidelines, and changed ICD coding practices are not reflected. Build retraining into the annual clinical IT budget, not as an optional future item.

What This Means for Healthcare Leaders

The clinical LLM market in India is moving fast. Eka Care has production deployments with 3,000+ doctors. Apollo, Fortis, and Manipal groups are in active evaluations. The window for early-mover advantage in physician productivity and patient throughput is roughly 18 months before the tooling becomes table stakes.

Three things you can do this week without engaging Codelynks:

First, run a language audit of your top five OPD specialties by volume. List every language combination that appears in consultations. Check whether your candidate ASR model has been validated on each. Eliminate any model that hasn’t been validated on Hindi and your primary regional language pair.

Second, ask your EMR vendor for the FHIR R4 API documentation and field mapping guide. If they cannot produce it within a week, your clinical LLM integration timeline needs to add four to six weeks for custom field extraction engineering.

Third, check your ABDM integration status. Specifically: is your platform enrolled to consume ABDM health records via the HIE-CM API, or only to create ABHA IDs? The former enables pre-fetch. The latter does not. The enrollment and sandbox testing process takes four to six weeks.

Conclusion:

Organizations investing in LLM Clinical Documentation India today will gain significant advantages in physician productivity, documentation quality, and patient experience.

More Blogs : RBI DPIP Fintech Data Pipeline Integration Guide 2026

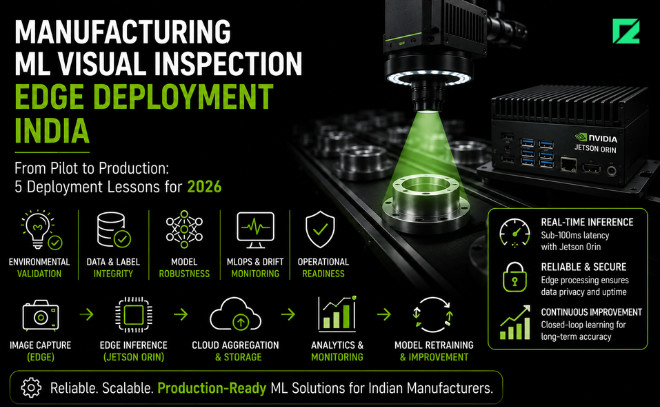
Manufacturing ML Visual Inspection Edge Deployment India

Manufacturing ML Visual Inspection Edge Deployment India

Introduction : Manufacturing ML Visual Inspection Edge Deployment India

A 2026 systematic review of industrial MLOps architectures, published in the International Journal of Computer Integrated Manufacturing, confirmed what anyone who has deployed production machine learning on a factory floor already knows: fully automated MLOps in manufacturing remains underdeveloped. Modular, scalable architectures with human-in-the-loop retraining are the production reality. Lab-validated models that go live without one degrade fast.

We work with a Tier-1 electrical goods manufacturer in Kerala running three production lines for wiring devices and switches. Their quality team had run a six-month pilot on surface defect detection using a convolutional neural network deployed on an NVIDIA Jetson Orin. Pilot results: 96% precision on surface scratches and 94% recall on dimensional non-conformance, compared to manual inspection accuracy averaging 78%. A genuinely strong result.

At the go-live review three months into production deployment, the precision had dropped to 71% on the same defect classes. Line supervisors had quietly reverted to manual inspection for one product family. The data science team was investigating the model. The model was not the problem.

This post covers what causes deployed ML models to drift on shop floors, the five engineering dimensions that separate a pilot from a production deployment, and the framework we use to assess readiness before any manufacturing client goes live with edge ML.

The Deployment Gap No Pilot Captures

Pilot ML evaluations are run on curated datasets, in controlled conditions, with lighting that the camera team set up specifically for the model validation exercise. Production shop floors are none of those things.

Four environmental factors cause post-deployment drift in manufacturing ML that pilots do not capture:

Shift lighting variation. Overhead lighting on most Indian factory floors shifts in color temperature and intensity between day shift, second shift, and night shift sometimes dramatically. A model trained on images from the day shift has seen a systematically different color distribution than what it encounters at 11pm. The visual signature of a surface scratch under fluorescent 4000K light and under sodium-vapor 2100K light is measurably different for a convolutional model, even if it looks the same to a human inspector.

Tooling wear and surface texture drift. As stamping and injection-mould tooling wears over weeks and months, the surface finish on parts changes gradually. The model’s training set captured the surface finish at a single point in the tooling lifecycle. When tooling has worn 15% beyond the training-set baseline, the defect-to-surface contrast ratio the model was trained to detect has shifted enough to increase false negatives.

New SKU introduction. A model trained on product family A does not generalize to product family B without retraining. Manufacturing teams routinely introduce new SKUs within a product line without informing the data science team. The model encounters images from an untrained class and either rejects everything or nothing.

Vibration and focus drift. Camera mounting on production lines is rarely as mechanically stable as the pilot camera rig. Vibration from adjacent equipment, temperature-induced expansion in mounting hardware, and periodic accidental displacement introduce focal variation that degrades model input quality over time.

“The shop floor does not care about your validation set. It cares about the lighting change when the second shift turns on.”

Edge vs. Cloud Inference: The Decision That Defines Everything

NVIDIA Jetson Orin has become the de facto standard for Indian manufacturing ML deployments in 2026. The reason is straightforward: production line inspection requires sub-100ms inference latency, and most Indian factory floors have network connectivity that makes cloud inference unreliable for real-time decisions.

The specific numbers from our Kerala client: their assembly line runs at 120 parts per minute. Each part requires a 6-side inspection image sequence. Cloud inference round-trip latency averaged 340ms on their factory network unacceptable for a line that expects a pass/fail decision before the part reaches the next station 500ms later. Edge inference on Jetson Orin at INT8 precision runs the same inference in 18ms.

The trade-off is model management. Edge inference means the model lives on hardware distributed across the factory floor. Every model update requires deploying firmware to multiple edge devices, coordinating downtime, and validating the updated model in production conditions before relaunching the line. This is manageable with the right MLOps pipeline. It is operationally painful without one.

The counterintuitive architecture finding: the right answer for most Indian manufacturers is not edge-only or cloud-only. It is edge inference for real-time pass/fail decisions during production, with cloud aggregation of inference results, confidence scores, and flagged images for batch retraining. The Jetson Orin handles the production line. The cloud handles the learning loop.

“Buying an NVIDIA Jetson Orin is not an AI strategy. Edge hardware without a model retraining pipeline is just an expensive camera.”

The Shop Floor ML Deployment Readiness Matrix (SFMDRM)

Five dimensions, each assessed before production go-live. A red on any dimension means the deployment should not proceed.

Dimension 1: Environmental Validation. The production environment matches the training environment across five variables: lighting (color temperature and intensity at all shifts); camera position and focus stability; part presentation consistency (orientation and conveyor speed variance); background material and color; and ambient vibration level. Minimum requirement: training images captured across all three shifts, all relevant product families, and with tooling at both new and end-of-life wear states.

Dimension 2: Edge Hardware Configuration. NVIDIA Jetson Orin configured for the required inference precision (INT8 for speed, FP16 for balance, FP32 for accuracy validation). Power delivery and thermal management confirmed for the production environment temperature range. Watchdog process configured to restart the inference service on crash. Network connectivity to the cloud aggregation endpoint was tested under realistic factory network conditions.

Dimension 3: Model Versioning and Rollback. Every model deployed to production has a version tag, a training dataset hash, and a performance benchmark record. A rollback procedure exists: when Dimension 5 monitoring triggers a retraining alert, production can revert to the previous model version within 30 minutes. Model update deployments have a validation gate the updated model must pass a 200-image holdout set before replacing the production model on the line.

Dimension 4 : Human-in-the-Loop Integration. The system does not make autonomous accept/reject decisions on borderline cases. Define a confidence threshold below which the system flags for human review rather than issuing a decision. The review queue must be accessible to the line supervisor in real time, with a response time expectation defined and enforced. Reject the architecture that removes the human from borderline decisions entirely.

Dimension 5 : Drift Monitoring and Retraining Triggers.Three production metrics monitored weekly: precision and recall on a sampled holdout of production images (requires periodic manual re-labelling of a small production sample by QC staff); false positive rate, which drives production line downtime when the model rejects conforming parts; and confidence score distribution, which shifts measurably before precision and recall metrics visibly degrade. Define retraining triggers: when precision drops 5 percentage points from the baseline, or false positive rate exceeds 8%, trigger a retraining cycle.

What “Monitoring” Actually Means on the Factory Floor

The standard MLOps monitoring approach: log predictions and alert on metric drift does not translate directly to manufacturing without one critical addition: you need periodic manual re-labeling of production images to maintain a ground-truth reference.

Your model runs on images that have never been labelled by a human. It is making predictions. You do not know if those predictions are correct unless someone periodically labels a sample. For a production deployment generating 50,000 images daily, a 200-image weekly sample labeled by a QC engineer takes approximately 45 minutes. That 45-minute investment is the difference between detecting drift before it becomes visible in scrap rates and finding out about it from the line manager.

Our recommendation: dedicate 2 hours per week of QC engineer time to production image labelling and model performance validation. Cost: trivial. Value: the early warning system that prevents a 96% pilot model from silently becoming a 71% production system.

“A model that scored 98% in the lab and 71% at month two did not fail. You deployed it into an environment it was never trained on.”

What This Means for Manufacturing Leaders

The AI visual inspection market in India is real and growing. NVIDIA Jetson Orin deployments are live in automotive, electronics, textiles, and packaged goods facilities across the country. The technology is production-proven. The gap is not the model. The gap is the deployment architecture and the operational discipline to maintain it.

The Industry 5.0 human-AI collaboration model is not a regression from full automation. It is the honest architecture for complex manufacturing environments where lighting, tooling, and SKUs change continuously. A human-AI system that maintains 92% precision at 18 months is more valuable than an autonomous system that peaked at 96% and was quietly abandoned after the third drift incident.

Three things you can do this week without engaging Codelynks:

First, run a lighting audit across all three shifts on your production lines. Photograph the same part under all shift lighting conditions and compare the images. If the color temperature variation is visually apparent to a human, it is a training data problem you need to address before any ML deployment.

Second, check your production camera mounting. Apply a reference fixture to the conveyor, start the line, and photograph it 100 times over 30 minutes. Measure position variation in the image frame. More than 5 pixel variation in the reference fixture position indicates a mechanical stability problem.

Third, if you have an active ML deployment, pull the model confidence score distribution from the last 30 days and plot it. A distribution shifting toward lower confidence scores, with more predictions clustering near the 0.5 boundary is an early drift signal that typically precedes visible precision decline by 3 to 4 weeks.

More Blogs : AI Engineering Services for Enterprises: What They Include and Why They Matter

RBI DPIP Fintech Data Pipeline Integration Guide 2026

RBI DPIP Fintech Data Pipeline Integration Guide 2026 showing real-time fraud intelligence architecture for banks, UPI platforms, and digital lenders.

Introduction

RBI DPIP Fintech Data Architecture is rapidly becoming a strategic priority for banks, lenders, and payment platforms across India. As the Reserve Bank of India’s Digital Payments Intelligence Platform (DPIP) expands, fintech organizations must redesign their data pipelines to support real-time fraud intelligence, streaming analytics, and sub-second risk decisioning.

What Is RBI DPIP?

We work with a Series B digital lending platform in Bengaluru processing approximately 40,000 disbursements monthly across 6 lakh active loan accounts. Their fraud team had built a capable batch-scoring pipeline: transaction data were collected hourly, features computed overnight, risk scores refreshed every 24 hours. It caught fraud well for fraud patterns that were 24 hours old. When we mapped their architecture against what DPIP requires, the gap was immediate: DPIP emits fraud signals in real time at transaction trigger. A pipeline running on hourly batch jobs cannot consume a signal that expires in milliseconds.

This post covers what DPIP actually requires of your data architecture, the three pipelines every fintech platform now needs to run in parallel, and the four-rung framework we use to assess whether a platform’s data infrastructure can support real-time risk decisioning at UPI scale.

Why DPIP Changes Fintech Data Architecture

DPIP is a network-level fraud intelligence system. When a suspicious transaction is initiated on one UPI app, DPIP propagates a fraud signal device fingerprint, transaction pattern, and linked account flags across all connected apps and banks before the transaction clears. The goal, as the RBI framed it, is to make UPI the first payment network where fraud is stopped before a single rupee moves.

The engineering implication is specific: DPIP is a streaming data source, not a batch API. Consuming DPIP fraud signals means building or extending a real-time event streaming pipeline, not polling an endpoint. The signals are time-decaying; a fraud flag is most actionable within the 300 to 500 milliseconds before the UPI transaction completes the NPCI routing layer. A platform polling DPIP every five minutes is consuming a signal that is irrelevant to any live transaction.

“Your batch fraud model is detecting yesterday’s fraud. DPIP is designed to stop fraud before the transaction clears.”

This is not a hypothetical future-state problem. Mule account detection, the primary fraud vector DPIP targets, is already operating in near real time across major PSP apps. Platforms that connect to DPIP late will have higher fraud rates, not because their models are weaker, but because they are operating on stale signals.

March 2026’s UPI transaction volume was 2,264 crore, that is, 22.64 billion transactions in a single month. The fraud detection pipeline your team built in 2022 was designed for a fraction of that scale and a batch-first world. Both of those assumptions are now wrong simultaneously.

The Three Data Pipelines Every Fintech Platform Needs

Most fintech data platforms are running one fraud pipeline. A DPIP-integrated platform needs three, operating in parallel with different latency requirements and different data sources.

Pipeline 1 Real-Time Transaction Scoring (sub-500ms). This pipeline receives the transaction event, enriches it with device fingerprint, Account Aggregator signals (more on this below), and DPIP fraud flags, and returns a risk score within the UPI processing window. The technology stack for this pipeline cannot be batch-oriented: Kafka or Pulsar for event streaming, a feature store with sub-100ms read latency (Redis or Apache Pinot), and a model inference endpoint that can handle peak UPI transaction volumes without queuing.

Pipeline 2 Near-Real-Time Pattern Detection (1 to 5 minutes). This pipeline aggregates transaction sequences across a short lookback window, typically 15 minutes, to detect velocity attacks, micro-transaction probing, and coordinated fraud rings. It consumes from the same Kafka topics as Pipeline 1 but runs with a windowed aggregation using Apache Flink or Spark Streaming. Output feeds back into the feature store to enrich Pipeline 1’s real-time decisions.

Pipeline 3 Batch Retrospective Analysis (nightly). This pipeline computes features that require long-window lookbacks: 30-day transaction patterns, seasonal baseline deviations, and account relationship graphs. Output populates the model training dataset and updates low-frequency risk features in the feature store. This is the pipeline most fintech teams already have. The problem is treating it as the primary fraud pipeline rather than the training and baseline pipeline it should be.

The counterintuitive cost finding from our work: running all three pipelines costs approximately 40% more in infrastructure than a single batch pipeline. But the fraud loss reduction from real-time scoring catching mule account transactions before they clear recovers that cost within the first quarter for any platform processing above 50,000 transactions daily.

Real-Time Transaction Scoring

The Account Aggregator framework has enabled consent-based financial data sharing across 450+ financial institutions as of early 2026. Most fintech platforms consume account aggregator data as a one-time pull at loan origination: bank statements for the last 6 months, aggregated and scored as part of underwriting.

That is the wrong architecture for a fraud prevention context.

“The Account Aggregator is not a data source. It is a real-time decision input that your pipeline needs to treat like any other streaming event.”

For DPIP-integrated platforms, Account Aggregator data should be treated as a streaming enrichment signal. When a high-value transaction is initiated on a loan account, the platform should pull the borrower’s most recent Account Aggregator data current balance and recent credit events as part of the real-time Pipeline 1 enrichment. This requires building a persistent account aggregator session with consent for recurring access, not a one-time consent at origination.

The latency challenge: Account aggregator API response times average 800 ms to 1.4 seconds under normal load. For Pipeline 1 running in a 500ms window, Account Aggregator data cannot be fetched synchronously. The pattern is to run a background refresh of Account Aggregator data every 15 minutes for active borrowers, write to the feature store, and read from the feature store within Pipeline 1. Freshness is bounded by 15 minutes, which is acceptable for fraud scoring on loan accounts.

Four rungs, each representing a distinct architectural capability. A platform cannot skip rungs each level’s infrastructure is a prerequisite to the next.

Rung 1 Streaming Infrastructure Baseline. A production Kafka or Pulsar cluster, properly partitioned for peak UPI transaction volume. A Redis or Apache Pinot feature store with sub-100ms read latency for real-time features. A model inference endpoint with autoscaling and p99 latency under 200ms. Without Rung 1, nothing above it is possible.

Rung 2 DPIP Signal Integration. Direct integration with DPIP’s fraud signal feed via NPCI’s designated API gateway. Event consumers subscribed to the relevant fraud signal topics. Logic to enrich incoming transaction events with current DPIP flags before scoring. Platforms at Rung 2 are consuming real-time fraud intelligence from the network.

Rung 3 Account Aggregator Real-Time Enrichment. Persistent Account Aggregator sessions with background refresh for active accounts. Feature store populated with fresh AA data on a 15-minute cycle. Real-time fraud scoring in Pipeline 1 enriched with current account balance and recent credit events. Platforms at Rung 3 are combining network-level (DPIP) and account-level (AA) signals in sub-500ms decisions.

Rung 4 Agentic Compliance Automation. NPCI is exploring agentic AI for compliance cycle automation. Rung 4 platforms are building agent workflows that consume compliance signals, generate required reporting automatically, and trigger remediation actions without manual intervention. This is the leading edge for 2026 and beyond, but it requires Rungs 1 to 3 to be stable first.

Common DPIP Integration Mistakes

Three failure modes we see consistently:

Kafka partition under-provisioning. A Kafka cluster provisioned for 2022 transaction volumes fails under UPI’s current scale during peak events like salary day and festival sales. The symptom is consumer lag fraud scores delayed by minutes, not milliseconds. The fix is partition rebalancing and consumer group scaling, but identifying the lag requires lag monitoring that most teams have not configured.

Feature store staleness without detection. A feature store that was updated hourly starts serving 90-minute-old features after a pipeline failure, with no alert triggered. The fraud model scores using stale data, rates shift unexpectedly, and the root cause takes hours to find. Fix: configure feature freshness SLAs and alert when any feature’s last-write timestamp exceeds its defined freshness threshold.

DPIP integration is treated as a one-time build. DPIP’s signal schema and API versions will evolve as NPCI expands the platform’s scope. Teams that build a one-time integration without a versioning contract and schema change monitoring will wake up to silent integration failures after an NPCI update.

What Financial Services Leaders Should Do Next

DPIP is live, and NPCI is expanding it. The platform’s value to any connected fintech scales with the number of connected participants, and participation is becoming an industry standard expectation for regulated payment platforms. The question is not whether to connect, but how fast and at what rung.

Three things you can do this week without engaging Codelynks:

First, run a consumer lag test on your existing Kafka cluster at 2x your current peak transaction volume. If consumer lag exceeds 30 seconds under simulated load, you have a Rung 1 problem before you can build Rung 2.

Second, pull the last 30 days of your feature store write timestamps. Find the three features with the highest average staleness. If any real-time scoring feature is more than 5 minutes stale on average, your model is not operating in real time, regardless of what the architecture diagram says.

Third, contact your account aggregator TSP (technology service provider) and ask for documentation on consent persistence for recurring access. If they do not support recurring access consents, your Platform 1 enrichment design needs a different approach from the one outlined above.

Conclusion

The shift toward DPIP Fintech Data Architecture is no longer optional for digital lenders, banks, and payment providers operating at scale. Organizations that continue relying on batch-first fraud systems will struggle to leverage real-time fraud intelligence and network-wide risk signals.

About the author: Codelynks Data Engineering Practice. The team has designed real-time risk data pipelines for digital lenders and payments platforms processing millions of transactions monthly. Connect on LinkedIn.

Mode Blog: How We Use Claude in Our Product Development

DPDP Cloud Compliance India: 7 Critical Requirements for Government Platforms in 2026

DPDP Cloud Compliance India: 7 Critical Requirements for Government Platforms in 2026

Introduction

DPDP Cloud Compliance India is becoming a critical priority for government departments, public-sector platforms, and citizen service providers. While many organizations focus on privacy notices and consent management, the Digital Personal Data Protection Rules 2025 also impose significant infrastructure requirements. Understanding DPDP Cloud Compliance India helps organizations prepare for data localization, audit logging, encryption, and citizen rights obligations before the May 2027 compliance deadline.

A state-level digital services integrator we work with in North India manages Aadhaar-linked beneficiary data across 12 social welfare schemes. When we ran their first DPDP gap assessment, their privacy policy was updated within 48 hours of the rules being notified. Their Kafka topics were still routing personal data through a Frankfurt-region cluster. Their encryption keys were managed by the hyperscaler’s default KMS, with no customer-managed key layer. Their access logs retained 30 days, against the 12-month requirement. The legal team had passed. The engineering team had not been asked.

This post covers what DPDP Rules 2025 actually require of your cloud stack, where the enforcement risk sits, and the four-layer architecture framework we use to remediate it before the Consent Manager deadline in November 2026. Organizations pursuing DPDP Cloud Compliance India must look beyond privacy notices and focus on infrastructure controls, audit readiness, and data localization requirements.

What Is DPDP Cloud Compliance in India?

The Rules impose four categories of technical obligation on Data Fiduciaries: Data residency. Personal data processed for Indian residents must remain within India unless the Central Government specifies cross-border transfer conditions. For government-adjacent platforms, the default assumption is full localization. The hyperscaler’s in-country region designation is necessary but not sufficient you must trace every data flow, including logs, backups, analytics pipelines, and CDN edge caches, to confirm none carry unencrypted personal data out of Indian territory.

Access and audit logging. Access to personal data must be logged with sufficient detail to demonstrate lawful processing. The practical minimum is role-based access logs, query-level audit trails, and 12-month retention. Most platforms running ELK stacks or Datadog have configured retention for cost optimization, not compliance. Shortening log retention to 7 or 30 days is common. Under DPDP, that is a liability.

Encryption standards. The Rules require personal data to be protected against unauthorized access. MeitY guidance expects AES-256 at rest and TLS 1.2+ in transit. The enforcement gap is key management: customer-managed keys (CMK) with defined rotation policies, separate from the hyperscaler’s default KMS, are the architecture standard for any platform handling sensitive government data.

Data principal rights APIs. Citizens have the right to access, correct, and erase their personal data. For cloud platforms hosting government schemes, this means building not promising to build API endpoints that can retrieve a user’s data across all storage systems, return it in a portable format, and execute erasure across primary stores, replicas, backups, and analytics copies. Most platforms have not designed for erasure across backup chains.

The Significant Data Fiduciary Designation: A Different Architecture Problem

The central government is expected to designate Significant Data Fiduciaries (SDFs) in Q3 2026. SDF designation triggers additional obligations: Data protection impact assessments for new processing activities, mandatory data audits by registered auditors, and explicit data localization requirements for specified categories covering traffic data as well as content.

Platforms managing government scheme data at scale are likely SDF candidates. The engineering implication is an audit-ready architecture: documented data maps, automated policy enforcement through cloud-native tools like AWS SCPs or Azure Policy, and the ability to produce a data processing record on demand.

The counterintuitive number: in our assessments, the engineering remediation work to meet DPDP logging and residency requirements represents roughly 40% of total compliance effort. Legal and consent management consume most of the remaining budget. Organizations spending 40% of engineering on consent UIs instead of data architecture are optimizing for the wrong audit surface.

The MeghRaj Question: MeghRaj, MeitY’s government cloud initiative, carries a specific data localization requirement for government systems. Platforms hosting government scheme data face a binary decision: run on MeghRaj-certified infrastructure (NIC, NICSI, or empanelled CSPs) or document and defend a technical equivalence argument for commercial hyperscaler infrastructure.

Most government-adjacent platforms are not on MeghRaj-certified infrastructure. The commercial hyperscalers (AWS ap-south-1, Azure India Central, GCP asia-south1) have MeitY empanelment for MEITY cloud services, but empanelment does not automatically satisfy scheme-specific data localization requirements imposed by the relevant ministry. This requires legal-technical co-review, and the answer is scheme-by-scheme, not platform-wide.

“Data localization is not a policy question. It is a routing question, an encryption key question, and a data residency verification question.”

The DPDP Cloud Alignment Stack (DCAS)

We use a four-layer framework to structure DPDP cloud remediation for government and government-adjacent platforms.

Layer 1 Data Inventory and Flow Mapping.Before any architecture change, map every personal data element, every system that touches it, and every network path it travels. This includes third-party integrations, analytics pipelines, and CDN configurations. Output: a verified data flow diagram with residency status and encryption state at each hop.

Layer 2 Residency Enforcement. Configure cloud-native policy guardrails to prevent personal data from leaving compliant regions. For AWS: Service Control Policies blocking resource creation outside ap-south-1 and ap-south-2. For Azure: Azure Policy with deny effects on non-India regions. For GCP: Organization Policy constraints. Implement CMK with defined rotation schedules on all personal data stores.

Layer 3 Audit Infrastructure. Enable query-level database audit logs (PostgreSQL pgaudit, MySQL audit plugin, or equivalent). Route to centralized log storage with 13-month retention (one month buffer above the 12-month requirement). Implement log integrity protection (S3 Object Lock, Azure Immutable Storage, or equivalent). Build alerting on anomalous access patterns.

Layer 4 : Rights Fulfilment APIs.Build or extend your platform API to support data subject access requests (DSAR): retrieve all personal data for a user ID, return in JSON-LD or equivalent portable format, execute erasure across all storage tiers including backups. The DPDP Rules set a 48-hour response clock for access requests and a 72-hour breach notification clock. Both require automated workflows, not manual processes.

The Timeline That Is Driving Real Urgency

Three deadlines define the next 18 months: The Consent Manager framework operationalizes between June and August 2026. Platforms that want to register as consent managers need a compliant consent infrastructure, and a consent infrastructure needs a compliant data architecture underneath it.

SDF designations are expected by Q3 2026. Being designated as an SDF without an audit-ready architecture creates immediate regulatory exposure. The DCAS framework provides a structured roadmap for achieving DPDP Cloud Compliance India across cloud environments and government-sector platforms. Early investment in DPDP Cloud Compliance India helps organizations avoid costly remediation projects as regulatory deadlines approach.

Full DPDP compliance is required by May 13, 2027. Engineering work at the scale of Layer 1-4 remediation for a platform handling lakhs of citizen data records takes 6 to 9 months. Organizations starting now are on the critical path. Organizations starting after SDF designations are announced will miss the deadline.

“Most DPDP compliance budgets are going to consent UI and legal review. The audit-failure risk lives in the cloud architecture.”

The DPDP Rules do not specify cloud vendors. They specify outcomes: data stays in India, access is logged, keys are controlled by the data fiduciary, and citizens can exercise their rights within 48 hours. Which cloud you run on is less important than whether your architecture actually delivers those outcomes.

What This Means for Government Sector Leaders

The Consent Manager deadline is not a legal milestone. It is an engineering milestone disguised as a legal one.

If your platform will process personal data under a registered consent manager by late 2026, the underlying data architecture must be audit-ready before the consent manager goes live. The Data Protection Board will audit data fiduciaries, not consent managers. The liability rests with your platform.

Three things you can do this week without engaging Codelynks:

First, run a data residency spot check: pull network flow logs for your primary personal data stores and verify every destination IP is within India. Most platforms find at least one surprise.

Second, check your audit log retention configuration across every database and cloud service. Set a reminder for 30 days from now to confirm nothing has reverted to default retention settings.

Third, identify whether your platform is likely to be classified as a significant data fiduciary. The criteria include scale of data processing, sensitivity of data types, and potential for harm. If you handle Aadhaar-linked or health-linked data at a meaningful scale, begin the DPIA process for your highest-risk processing activities now, before SDF designation makes it mandatory.

About the author: Codelynks Cloud Engineering Practice is led by a team that has designed and audited cloud architectures for government-adjacent platforms in India, the GCC, and Southeast Asia. Connect on LinkedIn.

Conclusion

Achieving DPDP Cloud Compliance India requires more than legal reviews and consent banners. Organizations must build compliant cloud architecture, enforce data residency controls, strengthen audit logging, and automate data subject rights management. Starting early gives government platforms the best chance of meeting upcoming DPDP deadlines. Successful DPDP Cloud Compliance India programs combine legal, operational, and cloud engineering controls to create a sustainable compliance posture.

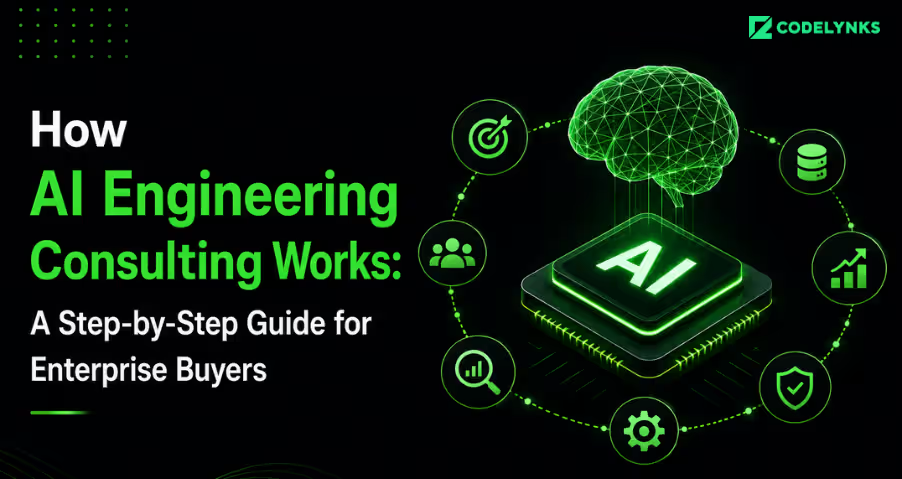
How AI Engineering Consulting Works: A Step-by-Step Guide for Enterprise Buyers

AI engineering consulting process for enterprise buyers with AI strategy and implementation roadmap.

Introduction

AI engineering consulting turns a business problem into a working AI system. This guide walks enterprise buyers through a full engagement, from the first scoping call to production. You will learn what each phase delivers, what your team supplies, how long the work takes, and what it costs.

What is AI engineering consulting?

AI engineering consulting is a professional service that helps companies design, build, and deploy AI systems into production. Consultants identify viable use cases, prepare data, build and test models, integrate them with existing systems, and support them after launch. The outcome is a reliable system that produces measurable business value.

It differs from strategy-only advisory. A strategist tells you what to do. An AI engineering consultant builds and ships the thing.

The AI engineering consulting process in 9 steps

Here is the engagement at a glance:

  1. Discovery and use case scoping: define the problem and success metrics
  2. Feasibility and technical assessment: Confirm the use case is buildable
  3. Data audit and preparation: check whether your data can support the model
  4. Proof of concept: build a small version to prove value
  5. Solution architecture and design: plan the production system
  6. Development and integration: build the system and connect it to your stack
  7. Testing and evaluation: validate accuracy, safety, and performance
  8. Deployment to production: release the system to real users
  9. Monitoring and optimization: track results and improve over time

The sections below explain each step.

Step 1: Discovery and use case scoping: The engagement starts with discovery. Consultants meet your stakeholders to understand the business problem, current workflows, and constraints. They identify candidate use cases and score each one on value and difficulty.

You leave this phase with a ranked shortlist of use cases and clear success metrics. A use case without a metric is a wish, not a project. Typical duration: one to three weeks.

Step 2: Feasibility and technical assessment: Next, the consultant checks whether the top use case is technically buildable. They review your systems, data sources, security requirements, and integration points. They flag risks early, before you spend on development.

The deliverable is a feasibility report. It states whether to proceed, what to build, and what could block you. Honest consultants will tell you to stop here if the case is weak.

Step 3: Data audit and preparation: AI systems run on data. Consultants audit your data for volume, quality, labeling, and access. They find gaps, clean records, and set up pipelines to move data where the model needs it.

This step often takes longer than buyers expect. Poor data is the most common reason AI projects stall. Budget real time for it.

Step 4: Proof of concept: A proof of concept (POC) is a small, working version that tests the core idea. The consultant builds it on a limited dataset to show whether the approach delivers. You see real output, not slides.

The POC gives you a go or no-go decision backed by evidence. Typical duration: two to six weeks. A failed POC is a cheap lesson, not a failure.

Step 5: Solution architecture and design: Once the POC proves value, the consultant designs the production system. They choose the models, infrastructure, security controls, and integration approach. They plan for scale, cost, and maintenance.

You receive an architecture document and a build plan. This is where enterprise concerns like compliance, data residency, and access control get locked in.

Step 6: Development and integration: Engineers build the system. They train or fine-tune models, write the application code, and connect everything to your existing tools. Work runs in sprints with regular demos so you see progress.

You stay involved through reviews and feedback. The deliverable is a working system in a staging environment, ready for testing.

Step 7: Testing and evaluation: Before launch, the system goes through testing. Consultants measure accuracy, latency, cost per request, and failure modes. They run safety and bias checks. They test against edge cases and adversarial inputs.

You get an evaluation report with hard numbers against your success metrics. A system that passes here is ready for real users.

Step 8: Deployment to production The consultant releases the system to production, often as a phased rollout. They set up monitoring, logging, and alerts. They prepare rollback plans in case something breaks.

Deployment is rarely a single switch. Expect a controlled launch to a subset of users first, then a wider release.

Step 9: Monitoring and optimization AI systems drift. Data changes, user behavior shifts, and accuracy can decline. Consultants set up monitoring to catch problems and retrain models as needed.

This phase is ongoing. Some buyers keep the consultant on a retainer. Others take over after a knowledge transfer and handover.

How long does an AI engineering consulting engagement take?

A focused engagement runs three to six months from discovery to production. Simple use cases finish faster. Complex enterprise systems with heavy integration and compliance needs take longer.

Here is a rough timeline by phase:

PhaseTypical duration
Discovery and scoping1 to 3 weeks
Feasibility assessment1 to 2 weeks
Data audit and prep2 to 6 weeks
Proof of concept2 to 6 weeks
Architecture and design1 to 3 weeks
Development and integration4 to 12 weeks
Testing and evaluation1 to 3 weeks
Deployment1 to 2 weeks

How much does AI engineering consulting cost?

Cost depends on scope, data readiness, and integration complexity. A proof of concept often runs in the low tens of thousands. A full production engagement for an enterprise typically runs into six figures.

Three factors drive the price up: messy data, strict compliance requirements, and deep integration with legacy systems. Ask any consultant to break their quote into phases so you can stop early if the value is not there.

What enterprise buyers need to provide

A consultant cannot work in a vacuum. Plan to supply:

  1. Access to data: the records the model will learn from
  2. A business owner: someone who owns the problem and the decision
  3. Subject matter experts: people who can judge whether output is correct
  4. Access to systems: the tools the AI must connect to
  5. A success metric: the number that defines done

The engagements that succeed have an engaged internal owner. The ones that fail treat the consultant as a vendor to ignore until delivery.

How to choose an AI engineering consulting partner

Look for four things:

  1. Shipped production systems: ask for live examples, not pilots
  2. Engineering depth: they build, not just advise
  3. Honest feasibility calls: they will tell you when to stop
  4. A clear phased plan: you can exit between phases

Avoid any partner who promises a fixed outcome before seeing your data. Real engineers scope after they understand the problem.

More Blogs : How We Use Claude in Our Product Development

How We Use Claude in Our Product Development

How We Use Claude in Product Development

Introduction

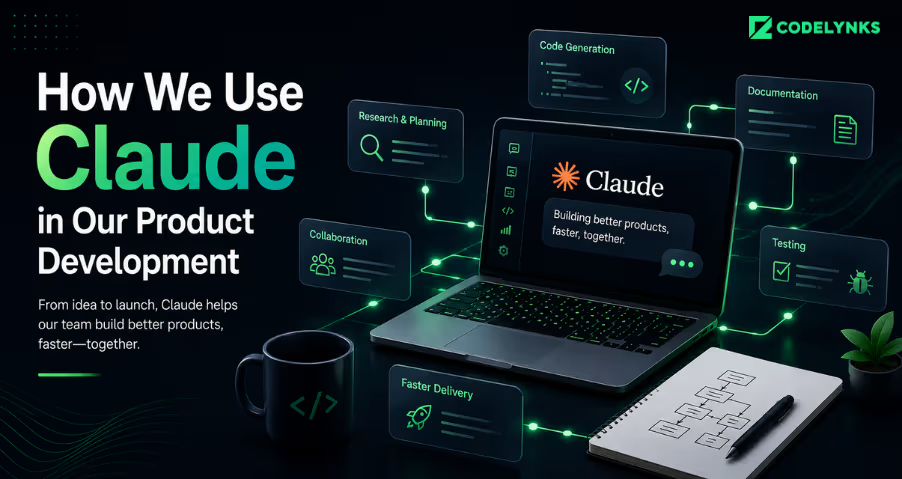
How We Use Claude in Product Development is one of the questions we hear most often from clients and engineering teams. AI is not a side experiment for us. It is embedded into our software development workflow, helping us prototype faster, improve code quality, automate repetitive engineering tasks, and accelerate product delivery. This article explains how we use Claude in product development, where it fits into our process, and the safeguards we use to maintain quality and security.

How We Use Claude in Product Development Across the Software Lifecycle

We use Claude throughout the software development lifecycle, from discovery and prototyping to testing, deployment, and documentation. Rather than replacing engineers, Claude acts as a productivity multiplier that helps our teams focus on high-value engineering work.

7 Ways We Use Claude in Product Development

Faster Prototyping and Validation: One of the primary ways we use Claude in product development is rapid prototyping. Claude helps generate initial code structures, user flows, and business logic that can be tested quickly with stakeholders.

Code Generation and Review: We use Claude Code to assist with code generation, debugging, code reviews, and identifying potential edge cases. Every code change is reviewed and approved by an engineer before deployment.

AI-Powered Product Features: Another example of how we use Claude in product development is integrating AI capabilities directly into applications. Through the Anthropic API, we build intelligent features such as summarization, smart search, workflow automation, and customer support assistants.

Engineering Automation: Claude helps automate repetitive engineering activities, including test creation, migration scripts, documentation updates, and deployment preparation.

Technical Research and Documentation: We use Claude to accelerate technical research, summarize documentation, and create first drafts of API documentation, architecture guides, and internal knowledge resources.

Testing and Quality Assurance: Testing is another area where we use Claude in product development. Claude generates test cases, identifies edge conditions, and helps engineering teams improve software quality and test coverage.

Continuous Improvement: Claude supports ongoing product enhancement by helping teams analyze feedback, identify recurring issues, and prioritize improvements based on user needs.

How We Use Claude in Product Development While Maintaining Quality and Security

Speed only matters when quality remains high. Every release is reviewed and approved by experienced engineers. AI-generated code, content, and documentation are validated before production use.

We also follow strict security practices. Production data is never exposed to AI systems, and all outputs are reviewed for accuracy, security, and compliance requirements.

Results from How We Use Claude in Product Development

The impact of how we use Claude in product development is measurable. Our teams prototype faster, improve testing coverage, automate repetitive work, and spend more time solving complex business problems.

By reducing manual effort across engineering workflows, we can focus on innovation, product quality, and customer outcomes. The result is faster delivery, more consistent processes, and better software products for our clients.

Conclusion

How We Use Claude in Product Development continues to evolve as AI technology advances. Today, Claude helps us accelerate software delivery, automate routine engineering tasks, improve testing, and create intelligent product experiences. Combined with human expertise, strong engineering practices, and rigorous quality controls, it enables us to build better products faster while maintaining high standards of security and reliability.

More Blogs: Benefits of AI Engineering Consultancy: What Enterprises Actually Gain

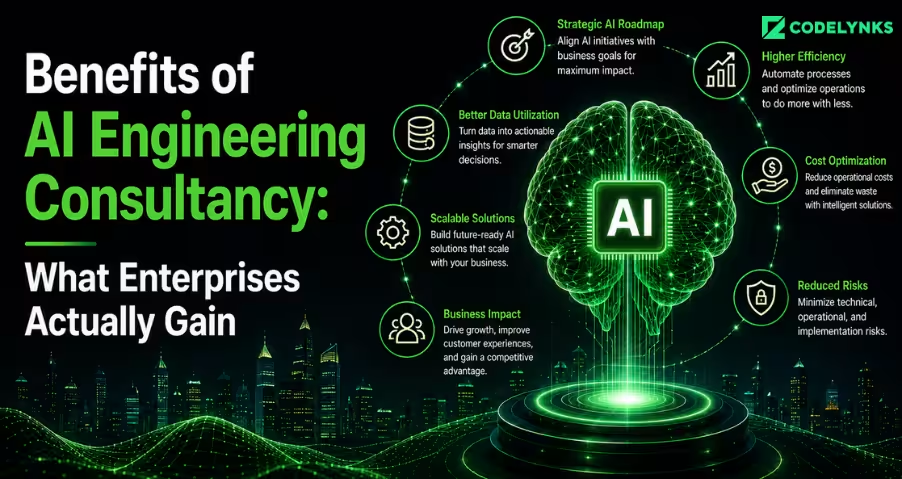
Benefits of AI Engineering Consultancy: What Enterprises Actually Gain

Benefits of AI Engineering Consultancy for Enterprise AI Success

Introduction

The benefits of AI engineering consultancy go far beyond technical expertise. Hiring an AI engineering consultancy is a spend decision, so the right question is not “what do they do” but “what do we get.” This post explains the benefits of AI engineering consultancy, the business outcomes enterprises can expect, and where the value shows up across the organization.

Understanding the Benefits of AI Engineering Consultancy

An AI engineering consultancy is a firm that designs, builds, and deploys production AI systems for clients. It combines machine learning, data engineering, and software engineering to ship working systems. The deliverable is a system in production, supported and measured. With that defined, here is what enterprises get from one.

Access to scarce talent without the hire: One of the biggest benefits of AI engineering consultancy is immediate access to specialized talent without a lengthy recruitment process. Senior AI engineers are hard to find and slow to hire. A single specialist can take six months to recruit and command a high salary. A consultancy gives you a full team on day one.

You get machine learning engineers, data engineers, and MLOps specialists together. You pay for the work, not a permanent headcount. When the build ends, the cost ends.

Faster time to production:Among the key benefits of AI engineering consultancy is the ability to accelerate the journey from prototype to production. Internal teams often stall between prototype and production. They lack the deployment experience to cross that gap. A consultancy has crossed it many times.

This shortens delivery from years to months. A focused engagement reaches production in three to six months. Faster delivery means the business sees value sooner and the investment pays back faster.

Lower project risk: Most AI projects fail or stall. A consultancy reduces that risk through structure. The work runs in phases with a go or no-go decision at each one.

Feasibility checks happen before the build. A proof of concept tests value at low cost. You can stop early if the case is weak. This phased approach turns a large bet into a series of small, controlled ones.

Systems that survive production: A model that works once is not a system that works daily. Real production AI needs monitoring, retraining, and error handling. Consultancies build this in from the start.

The result is reliability. The system stays accurate as data shifts. It recovers when something breaks. This is the difference between a demo and an asset.

Cost efficiency: Long-term cost savings are another important benefit of AI engineering consultancy engagements.AI can get expensive fast. Oversized infrastructure and inefficient models drive up inference and cloud bills. Experienced engineers right-size the architecture.

They choose the smallest model that meets the need. They control compute and storage costs. Over the life of the system, this discipline saves far more than the consultancy fee.

An honest outside perspective: Internal teams carry bias toward their own ideas. They may push a project that should stop. A good consultancy gives you a straight feasibility call.

They will tell you when an idea will not work. They will tell you when your data cannot support it. A no at the start saves you from a costly failure later.

Built-in governance and compliance: Enterprises answer to regulators and auditors. AI brings new risks around bias, safety, and explainability. Consultancies build governance into the system rather than bolting it on later.

They test for bias and safety. They document how the system makes decisions. They handle data residency and access control during design. This keeps you defensible when questions come.

Knowledge transfer to your team: Sustainable capability building is often an overlooked benefit of AI engineering consultancy partnerships. The best engagements leave you stronger. A quality consultancy hands over documentation and trains your staff. Your team learns to run and extend the system.

You avoid permanent dependence on the firm. The capability stays in-house after the engagement ends. This is value that outlasts the project.

The benefits in one view

BenefitBusiness outcome
Access to scarce talentSkilled team without a long hire
Faster time to productionEarlier payback on the investment
Lower project riskControlled spend, fewer dead projects
Production reliabilityA system that stays up and accurate
Cost efficiencyLower infrastructure and inference bills
Honest feasibility callsAvoided cost of building the wrong thing
Governance and complianceDefensible, auditable AI
Knowledge transferIn-house capability that lasts

When the benefits are largest

These benefits compound under certain conditions. An AI engineering consultancy returns the most when:

  1. You have a clear business problem and a metric to hit
  2. Your data exists but needs work
  3. You lack senior AI engineering talent internally
  4. The system must integrate with complex legacy tools
  5. Compliance and governance are non-negotiable

If all five are true, outside engineering help is often the fastest path to a working system.

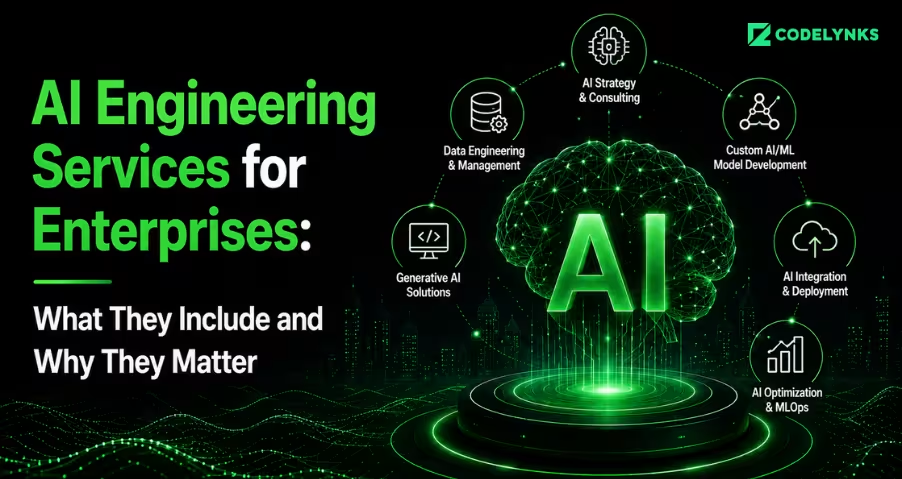
AI Engineering Services for Enterprises: What They Include and Why They Matter

AI Engineering Services for Enterprises with AI development, MLOps, data engineering, and machine learning solutions.

Introduction

AI engineering services for Enterprises are becoming essential as organizations move from AI experimentation to production deployment. Most enterprises do not fail at AI because of bad ideas. They fail at the build. A model that works in a notebook is not a system that works in production. AI engineering services close that gap by turning AI concepts into scalable, secure, and reliable business systems.

This post explains what enterprise AI engineering services cover, why large organizations need them, and how to pick a provider that ships.

What are AI engineering services?

AI engineering services are professional services that design, build, deploy, and maintain AI systems for production use. They combine data engineering, machine learning, software engineering, and operations to deliver systems that run at scale. The work ends with a live system, not a slide deck.Strategy tells you where to go. AI engineering gets you there.

Why enterprises need AI engineering services

Enterprises carry weight that startups do not. Legacy systems, strict compliance, large data volumes, and many stakeholders all slow AI down. Building AI inside this environment takes engineering discipline, not just data science.

Three problems push enterprises toward outside engineering help:

  1. The skills gap. Senior ML and AI engineers are scarce and expensive to hire.
  2. The production gap. Internal teams build prototypes that never reach users.
  3. The integration gap. New AI has to connect to systems built decades ago.

AI engineering services solve all three. They bring the people, the production discipline, and the integration experience in one team.

Core AI engineering services for enterprises:

A full provider covers the lifecycle from data to deployment. Here are the services that matter most.

Data engineering and pipelines: AI runs on clean, accessible data. Engineers build pipelines that collect, clean, and move data to
where models need it. They fix quality problems that block accuracy. Without this layer, nothing downstream works.

Custom machine learning development: Off-the-shelf tools rarely fit a complex enterprise need. Engineers build and train custom models for your specific problem. This covers prediction, classification, recommendation, forecasting, and anomaly detection.

Generative AI and LLM integration: Many enterprises now want large language models inside their products and workflows. Engineers integrate LLMs for search, support, document processing, and content generation. They add retrieval, guardrails, and evaluation so the output stays accurate and safe. Popular foundation model providers include OpenAI and Anthropic, whose models are widely used in enterprise AI applications.

AI system architecture and integration: A model is one part of a system. Engineers design the full architecture and connect the AI to your existing stack, including CRMs, ERPs, and internal tools. They plan for scale, cost, and security from the start.

MLOps and deployment: Models need a path to production and a way to stay healthy there. MLOps services cover deployment, versioning, monitoring, and retraining. This is the discipline that keeps AI working after launch, when most projects quietly break.

Model evaluation and governance: Enterprises answer to regulators, auditors, and customers. Engineers build evaluation and
governance into the system. They test for accuracy, bias, and safety, and they document how the system makes decisions.

Enterprise use cases for AI engineering: AI engineering services apply across functions and industries. Common examples:

Function Example application
Customer serviceLLM assistants that resolve tickets and route
cases
FinanceFraud detection and risk scoring at scale
OperationsDemand forecasting and supply chain
optimization
Sales and marketingLead scoring and personalization engines
Legal and complianceDocument review and contract analysis
ManufacturingPredictive maintenance on equipment

The pattern is the same in each case. A repeatable, data-heavy task becomes faster and more accurate with a system built around it.

Benefits of enterprise AI engineering services

Done well, these services produce results you can measure:

  1. Faster delivery. A specialist team ships in months, not years.
  2. Lower risk. Phased builds let you stop before large spending.
  3. Production reliability. Systems built by engineers stay up and stay accurate.
  4. Cost control. Right-sized architecture keeps inference and infrastructure costs in check.
  5. Internal capability. Good providers transfer knowledge so your team can run the system.

The point is not AI for its own sake. The point is a working system tied to a business metric.

How to choose an AI engineering services provider

Not every vendor that says AI can build production systems. Screen for four things:

  1. Production track record. Ask for live systems with real users, not pilots.
  2. Full-lifecycle capability. They handle data, build, deployment, and support.
  3. Enterprise experience. They know compliance, security, and legacy integration.
  4. Phased engagements. You can exit between phases and keep what was built.

Walk away from anyone who quotes a fixed price before seeing your data. Serious engineers scope after they understand the problem.

What it costs and how long it takes

A proof of concept usually runs a few weeks and lands in the low tens of thousands. A full production engagement runs three to six months and into six figures for an enterprise.

Three factors move the numbers: data quality, compliance requirements, and integration depth. Messy data and deep legacy integration cost the most. Ask for a phased quote so you control spend at each stage.

Related blog: How We Use Claude in Our Product Development

AI SecOps India : What it is and how to implement it

AI SecOps India Security Operations Center Dashboard

Introduction

AI SecOps India is becoming a critical strategy for organizations facing rising cyber threats, strict compliance requirements, and a growing cybersecurity talent shortage. Indian security teams are losing a race they were never staffed to win.AI SecOps India is rapidly becoming a strategic priority for enterprises that need faster threat detection, automated response, and regulatory compliance.

AI SecOps is the response to that gap. This article explains what it is, why it matters specifically in the Indian regulatory context, and how to roll it out without creating new risk. The guidance here reflects how we at Codelynks approach security operations for Indian clients: foundation first, compliance mapped in early, automation layered on top.

What AI SecOps actually mean

Start with the building blocks. A Security Operations Center (SOC) is the team that monitors systems, detects threats, and responds to incidents. SecOps is the wider set of strategy, processes, and technology that makes the SOC work. The core platforms are SIEM (Security Information and Event Management) for log collection and correlation, and SOAR (Security Orchestration, Automation, and Response) for automated playbooks.


AI SecOps adds machine intelligence to that stack. It is not a copilot bolted onto an analyst’s screen. A real AI-driven SOC uses agentic AI to triage alerts, investigate them, and remediate threats across the full incident lifecycle, from first signal to closed case.
The distinction matters. Point tools and copilots make analysts marginally faster. They do not change how operations run. A true AI SOC automates the grunt work so humans handle complex investigations and judgment calls. Some vendors now report auto remediation of the majority of cases in minutes, with analysts reclaiming hours each day.

Humans are not removed from the loop. They move up the value chain. AI handles volume and repetition. People handle ambiguity, escalation, and decisions that carry business or legal weight. The goal of AI SecOps India is to reduce manual workloads while improving security outcomes through intelligent automation.

Why AI SecOps India Matters in 2026

Three forces make AI SecOps less of a nice-to-have and more of an operational floor for Indian organizations.

The threat landscape turned industrial. 2026 marks the shift to factory-scale cybercrime, where attacks are mass-produced rather than handcrafted. India is among the most aggressively targeted markets globally. A 2025 analysis found that 47% of Indian adults had experienced or knew someone hit by AI voice-cloning or deepfake scams, nearly double the global average. As UPI volumes pass 15 billion transactions a month, the attack surface keeps widening into rural areas and small merchants.

The talent math does not work. India needs over 150,000 new cybersecurity professionals every year and runs a structural workforce gap above 400,000 roles. You cannot hire your way to 24×7 coverage at that deficit. Automation is the only way most teams reach round-the-clock detection and response without burning out the staff they have.

The market is already moving. The India cybersecurity market is projected to grow from USD 8.58 billion in 2025 to USD 16.86 billion by 2030. Spending is shifting from traditional tools toward AI-powered, cloud-native, and managed security services. Log management and SIEM lead the market today, and services are growing faster than products. The direction of travel is clear.

The compliance layer that makes India different : One of the biggest advantages of AI SecOps India is its ability to streamline compliance reporting workflows across multiple regulators. This is where generic AI SecOps advice falls short. India runs parallel, overlapping reporting obligations, and your security operations have to satisfy all of them at once.

CERT-In, six hours. The CERT-In Directions of April 2022 require organizations to report 20 categories of cyber incidents within six hours of becoming aware of them. The clock starts at “noticing,” which is not limited to the CISO’s desk. An MSSP alert, a P1 SOC ticket, or a credible third-party disclosure can all start the timer. Non-compliance attracts penalties under Section
70B of the IT Act, including fines and possible imprisonment.

DPDP Act, separate channel and clock. The Digital Personal Data Protection Act does not replace CERT-In. A personal data breach requires notification to the Data Protection Board and to affected individuals, on its own timeline. Penalties run up to ₹250 crore. The same incident may have to be filed twice, to two regulators, on two different clocks, through two different channels.

Sectoral regulators stack on top. RBI, SEBI, and IRDAI each impose cyber resilience and incident reporting duties on regulated entities. RBI explicitly encourages automation for alert triaging, incident response, and reporting, provided governance, auditability, and control are maintained. These regulators share a common control baseline but apply it in their own sector context.

Logs and timestamps are mandatory. Entities must retain ICT system logs for 180 days, with accurate timestamping against Indian NTP servers. If your SIEM cannot reconstruct an intruder’s path, you cannot file a defensible report inside the deadline. Log fidelity is a legal requirement, not an engineering preference.

Two consequences follow for anyone building AI SecOps in India. First, your incident response playbook must fan a single internal trigger out to both CERT-In and DPDP channels with the right detail for each. Second, automation has to preserve a clean audit trail, because regulators will ask you to prove what happened and when.

How to implement AI SecOps India: A Practical Sequence

Do not start by buying an autonomous SOC. Start by fixing the foundation, then layer intelligence on top. Here is a workable order.

Get your data and logging right first: AI is only as good as the telemetry it sees. Centralize log collection across cloud and on-prem. Make critical source logs immutable. Lock NTP configuration to Indian time servers and alert on drift. Build an asset inventory of internet-facing systems. Run data discovery to find where personal and sensitive data lives, so you can assess DPDP exposure during an incident. This step alone improves both detection and your ability to report.

Map your compliance obligations into the workflow: Before automating anything, write down which incidents trigger which reports, on which clocks, to which regulators. Build the “reportable incident” tag into your SIEM or XDR with one-click export packs. Map obligations across CERT-In, DPDP, and your sector regulator so a single incident does not generate inconsistent or duplicated filings. Bake the notification workflow into the response playbook, not into someone’s memory.

In our experience running this for regulated clients, this step is where most rollouts go wrong. Teams treat reporting as an afterthought, then scramble when the six-hour clock starts. Do the mapping while the system is calm, not during an incident.

Add automation where volume is highest: Target the work that buries analysts: alert triage, enrichment, and routine containment. SOAR playbooks accelerate investigation and response on known patterns. This is where you free up the most analyst time fastest, and where errors are lowest risk because the actions are well understood. Organizations adopting AI SecOps India often see significant reductions in alert fatigue and investigation times.

Introduce agentic AI with humans in the loop: Once automation is stable, add AI agents that investigate and recommend. Keep approval gates on actions that carry real consequence, such as isolating a production server or notifying a regulator. The goal is machine speed on detection and triage, human judgment on decisions that affect customers, money, or legal exposure. Give junior analysts AI-driven context so they resolve complex cases with the guidance of a seasoned expert.

Measure outcomes, not tool count: Track mean time to detect (MTTD) and mean time to respond (MTTR). Buyers and boards
increasingly care about these numbers over how many tools you own. Co-managed models, where you share operations with a provider, are gaining ground precisely because they tie tomeasurable response metrics.

Build, buy, or co-manage: Most Indian organizations cannot staff a full 24×7 AI SOC in-house given the talent gap. You have three realistic paths.

Build in-house if you have the scale, budget, and ability to retain senior SOC engineers. This ives maximum control and is often necessary for large regulated entities with strict data residency needs.

Buy SOC-as-a-Service or MDR from a managed provider. You rent 24×7 detection and response capacity instead of constructing it. This is the fastest route to coverage for mid-sized firms and startups facing CERT-In and DPDP duties without a security team to match.

Co-manage by splitting operations with an MSSP. You keep ownership of strategy and sensitive decisions while the provider runs continuous monitoring and tier-one work. This hybrid is growing fastest because it balances control against the staffing reality.

Whichever path you choose, confirm the provider can produce CERT-In and DPDP-ready reporting on your timelines, and that contracts extend data protection obligations to them. Under the DPDP Act, the data fiduciary keeps ultimate responsibility even when a processor handles the data.

Common mistakes to avoid: Treating AI as a replacement for analysts rather than a force multiplier. The teams that succeed redeploy people to higher-value work; they do not cut headcount and hope.

Automating before the data foundation is solid. Garbage telemetry produces confident, wrong AI decisions at scale.
Ignoring auditability. If you cannot show a regulator the reasoning and timeline behind an automated action, that automation becomes a liability during an investigation.

Building for one regulator. India’s obligations are parallel. A playbook that satisfies CERT-In but forgets the DPDP notification leaves you exposed.

Conclusion

AI SecOps India is the practical answer to three challenges facing modern enterprises: industrialized cyberattacks, cybersecurity talent shortages, and complex compliance obligations.

The organizations that get value treat it as a disciplined rollout, not a purchase. Fix the data layer. Map the compliance obligations into the workflow. Automate the volume. Add agentic AI with human judgment on the decisions that matter. Then measure MTTD and MTTR, and improve from there.

Start with one well-instrumented workflow and prove the model. Scale from what works. If you want a second set of eyes on where to start, that’s the kind of groundwork the Codelynks teamdoes with Indian clients every week.

  • Copyright © 2026 codelynks.com. All rights reserved.

  • Terms of Use | Privacy Policy