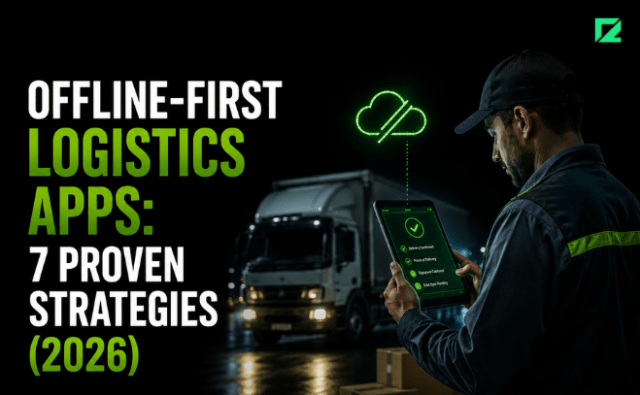
Offline-First Logistics Apps enable delivery executives to continue completing deliveries, capturing proof of delivery, and updating shipment status even when network connectivity is unavailable. A 3PL operator with 4,500 delivery executives across 11 states was losing, on average, 340 failed deliveries per day. Not because drivers were absent or packages were missing — because the delivery app was showing a blank screen. The drivers were in areas with intermittent connectivity — industrial zones, market areas in Tier-2 cities, lift lobbies in apartment complexes — where the app lost its server connection and became unusable.
The failed deliveries were not a network problem. They were a software architecture problem.
What Are Offline-First Logistics Apps?
Offline-first is not a feature. It is a contract between the app and the delivery executive that says: you will never lose work because of a bad signal.
A delivery app that is “offline-friendly” stores the delivery list locally when connectivity is available and allows deliveries to be marked in some degraded mode when offline. This is what most logistics platforms claim when they say “offline support.”
A genuinely offline-first app does something different: it treats local storage as the primary data store and the server as a sync target. The app writes delivery status changes, proof of delivery photos, OTP confirmations, and exception notes to local storage first, every time, regardless of connectivity. Sync to the server happens opportunistically when connectivity is available, with conflict resolution logic that handles cases where the server state changed during the offline period.
The difference matters at 3G signal strength in a Tier-2 city. An offline-friendly app stalls or errors. An offline-first app continues working. This architectural approach is what separates Offline-First Logistics Apps from conventional delivery applications that depend on continuous network connectivity.
The Architecture Decisions That Cannot Be Deferred
Building offline capability as a phase-2 deliverable is the most common mobile logistics mistake we see. It requires data model decisions that cannot be retrofitted without a full rewrite.
The success of Offline-First Logistics Apps depends on making these architectural decisions before development begins rather than treating offline capability as a future enhancement.
The specific decisions that must be made before line one of code is written:
Local data model. What data structures live on the device? The delivery manifest, POD data, customer contact details, and map geometry must be serialized to the device at manifest assignment time. Their schema must match the server schema exactly, or sync conflicts are guaranteed. A well-designed local database is the foundation of reliable Offline-First Logistics Apps, enabling uninterrupted delivery operations even in low-connectivity environments.
Sync conflict resolution strategy. The sync conflict problem in logistics apps is a business problem disguised as a technical problem. Which system wins when the driver marks a delivery complete and the customer simultaneously marks it undelivered? When the dispatch system reroutes a delivery while the driver is offline? These cases must be enumerated and resolved as business rules before the conflict resolution code is written. Writing the code first and determining the rules later produces a system where conflict resolution behavior is neither intentional nor explainable.
A well-designed local database is the foundation of reliable Offline-First Logistics Apps, enabling uninterrupted delivery operations even in low-connectivity environments.
Proof of delivery (POD) storage. POD photos and customer signatures must be stored locally and synced separately from transactional records. Photos are large (500KB to 2MB per photo). Syncing them over 2G on a 40-delivery manifest would exhaust the driver’s data plan. Use a background sync queue for POD attachments with quality downscaling (600px width is sufficient for POD verification) and background upload when on WiFi or strong 4G.
Manifest staleness handling.What happens when a driver has been offline for 3 hours and the manifest has changed server-side? Deliveries rerouted, removed, or added while the driver was offline need to surface to the driver when connectivity resumes — without overwriting the delivery status changes the driver made while offline. This is a three-way merge problem: server state, local state, and the driver’s in-progress work must be reconciled.
Organizations planning to deploy Offline-First Logistics Apps should evaluate every platform using structured criteria instead of relying solely on vendor demonstrations.
The Logistics App Offline Readiness Matrix (LAORM)
LAORM evaluates a logistics driver app across four dimensions. Use it to evaluate a SaaS platform before procurement, or to assess a custom build before committing to launch.
Dimension 1: Manifest and route availability offline
Score this dimension against three criteria:
– Can the driver view their full delivery manifest (all stops, addresses, customer contact) without connectivity? (Pass/Fail)
– Is the route geometry available offline for turn-by-turn navigation? (Pass/Fail — note that Google Maps offline requires pre-downloaded regions; HERE Maps and Mapbox support offline tile downloads via SDK)
– Is the manifest updated with rerouting changes when connectivity resumes without driver action? (Pass/Fail)
A platform that fails any of these is online-first, not offline-first.
Dimension 2: Status update and POD capture offline
– Can the driver mark delivery status (attempted, delivered, failed, rescheduled) without connectivity? (Pass/Fail)
– Does the app capture customer signature or OTP confirmation offline and sync on reconnect? (Pass/Fail)
– Does the app capture and store POD photos locally with background sync? (Pass/Fail)
Dimension 3: Conflict resolution and data integrity
– Does the platform have a defined conflict resolution strategy for delivery status conflicts? (Defined/Undefined)
– Are conflict resolutions logged for audit and dispute resolution? (Pass/Fail)
– Does the sync process handle partial connectivity (requests that start on connectivity and lose it mid-flight)? (Pass/Fail)
Dimension 4: Device compatibility and storage management
– Does the app function on Android Go devices with 2GB RAM and 16GB storage? (Critical for Indian market)
– Does the app implement storage limits on local manifest data to prevent device storage exhaustion? (Pass/Fail)
– Does the app handle storage permission revocation gracefully (POD photo storage requires WRITE_EXTERNAL_STORAGE or scoped storage on Android 10+)? (Pass/Fail)
Indian 3PL operators should not adopt a SaaS last-mile platform without evaluating its offline behavior in a 2G/3G test environment first. Platform demos always run on the engineer’s 5G phone, not on the delivery executive’s entry-level Android in Nagpur.
Flutter as the Build Choice for Indian Logistics Apps
Flutter is the correct framework for Indian logistics driver apps for three reasons specific to this market.
Flutter has become a preferred framework for developing Offline-First Logistics Apps because it combines native performance with a mature ecosystem for offline databases and background synchronization.
**Single codebase for Android-heavy fleets.** Indian delivery executive fleets are 90 to 95 percent Android. Flutter’s Android support is production-grade, and a single Flutter codebase eliminates the maintenance overhead of a native Android plus iOS build. In a fleet of 4,500 devices, iOS is a management exception — it should be handled as a thin wrapper over the same business logic, not a separate codebase.
**Offline plugin ecosystem.** Flutter’s `drift` package (formerly Moor) provides a type-safe SQLite wrapper for local manifest storage. `hive` is appropriate for simple key-value session state. The `workmanager` plugin handles background sync tasks on both Android and iOS. These are mature libraries with production use cases in logistics applications.
**Low-end device performance.** Flutter compiles to native ARM code. On Android Go devices (the ₹7,000 to ₹12,000 price range that makes up a significant portion of Indian delivery executive fleets), Flutter apps perform consistently better than React Native apps, which run in a JavaScript runtime with non-trivial overhead on constrained RAM. Reliable performance on entry-level Android devices is essential for Offline-First Logistics Apps operating across Tier-2 and Tier-3 cities.
The build choice matters most at Dimension 4 of LAORM. Apps that fail on 2GB RAM Android Go devices cause the same problem as poor offline architecture — the delivery executive cannot work.
ONDC Integration for Offline-First Logistics Apps
ONDC’s expansion into logistics — with the Department of Posts joining as a Logistics Service Provider in January 2026 — means that logistics app architecture increasingly needs to support ONDC network participant APIs. For a 3PL operator integrating with ONDC buyers, the driver app’s delivery status events (out for delivery, delivered, failed delivery) must be translatable into ONDC-standard fulfillment state machine events. As India’s digital commerce ecosystem expands, Offline-First Logistics Apps will become increasingly important for maintaining seamless fulfillment updates across ONDC participants.
This is not a difficult integration, but it requires the local status model to be mapped to ONDC’s fulfillment state schema at design time. Apps designed with proprietary status enums that do not map cleanly to ONDC states require bridge logic that introduces sync delay between driver actions and buyer-visible status updates. Choosing Offline-First Logistics Apps is no longer just a technology decision—it is an operational strategy that directly impacts delivery success rates and customer satisfaction.
What This Means for Logistics Leaders
If you are evaluating a last-mile delivery platform for Tier-2 and Tier-3 India, run the LAORM evaluation before the procurement decision. The vendor will have scored their platform optimistically on all four dimensions — your job is to run a structured test in a controlled 2G environment and verify the claims.
If you are building a custom driver app, the three decisions that must happen before development starts: define the conflict resolution strategy as a business rule document signed off by operations, not just by engineering; confirm your Android device distribution and establish whether Android Go support is required; and specify the POD sync architecture including maximum photo size, sync queue behavior on low-storage devices, and audit log requirements.
These decisions do not take long to make. Changing them after launch takes months..
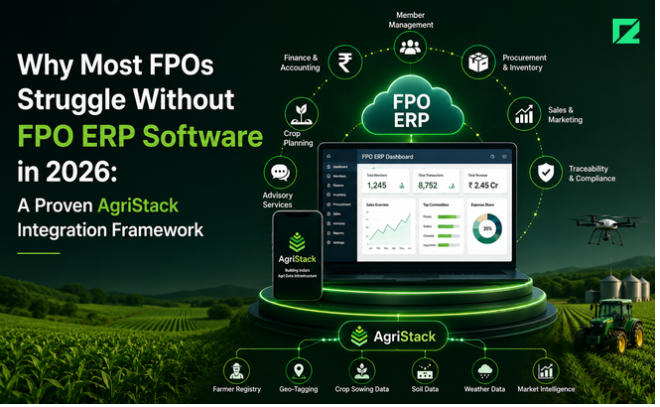
FPO ERP software is the missing operational layer in India’s digital agriculture ecosystem. India has achieved its target of 10,000 registered Farmer Producer Organizations (FPOs) under the PM FPO scheme, built AgriStack as a digital identity layer for over 140 million farmers, and launched Bharat-VISTAAR as an AI-powered agricultural advisory platform. However, most FPOs still lack the software needed to manage procurement, input distribution, output aggregation, market linkages, and financial services at scale.
The government has solved farmer identity and farmer advisory. What it has not built, and what fewer than 15% of registered FPOs currently have, is the operational software layer between the two: an ERP that connects the FPO’s procurement, input distribution, output aggregation, and market linkage operations to the national digital infrastructure that now surrounds it.
An FPO that cannot tell you its total procurement volume by crop and member in under 30 seconds is not a business. It is a paperwork exercise. And a paperwork exercise cannot absorb a ₹2,817 crore Digital Agriculture Mission, connect meaningfully to Bharat-VISTAAR’s advisory outputs, or access institutional credit at the scale that a 10,000-FPO network represents.
This post covers what FPO ERP software must actually do in 2026, how it connects to AgriStack, and a five-rung framework for building that integration in a sequence that delivers operational value at each stage.
What Existing FPO Software Gets Wrong
The software landscape for FPOs in India divides into three categories:
Category 1: Government portals. The FPO registration and compliance portal, state agricultural department platforms, and scheme reporting systems are designed for compliance reporting to government agencies. They are not operational tools. An FPO board member cannot use these to track how many quintals of wheat were received from which members in the last fortnight.
Category 2: Generic SME accounting software. Tally and similar tools handle basic accounts. They do not model FPO-specific workflows: input procurement for distribution, produce aggregation from heterogeneous land holdings, member-wise royalty calculation, or scheme-linked subsidy tracking.
Category 3: Agri-specific platforms targeting individual farmers.Platforms like AgroStar, DeHaat, and Bijak are designed for farmer-to-platform direct relationships. Their architecture assumes individual farmer accounts, not a collective institution managing procurement and distribution across hundreds of members.
None of the three categories produce the operational picture an FPO CEO needs to run a procurement cycle: who collected how much, at what moisture level, against what payment commitment, with what delivery scheduled to which buyer.
The FPO Digital Integration Ladder (FDIL) : The FDIL defines five rungs of operational and integration maturity for FPO software. Each rung adds value independently, but the rungs are in dependency order: Rung 3 (output aggregation) does not work accurately without Rung 1 (member registry linked to AgriStack).
Rung 1: Member Registry: The foundation of any FPO ERP is an accurate, complete member database. AgriStack’s Farmer Registry (the Farmer ID, or FID) is the natural anchor for this. Each farmer member of the FPO has an FID linked to their Aadhaar, land parcel records, and bank account.
Integrating the FPO member registry with AgriStack means:
– FID lookup at member onboarding (eliminates duplicate registrations and ghost members)
– Land parcel verification from the Bhoomi/Dharitree land record APIs, where available by state
– Bank account verification via NPCI account validation API (prerequisite for direct benefit transfer and royalty payment)
Most FPOs maintain their member lists in Excel files that have not been audited in two or three years. Rung 1 is the most unglamorous and most important work.
Rung 2: Input Management ;The FPO’s primary value to members in the Kharif and Rabi seasons is bulk input procurement: seeds, fertilizers, pesticides, and crop protection products purchased at scale and distributed to members at cost. Rung 2 covers:
– Procurement order management: what was ordered, from which supplier, at what price and quantity
– Input inventory tracking: what is in the warehouse by SKU and what has been allocated to members
– Distribution records: what each member received, in what quantity, and at what cost deduction against their seasonal account
Without Rung 2, an FPO board cannot accurately answer whether their bulk fertilizer purchase produced savings for members versus what members would have paid at retail.
Rung 3: Output Aggregation: This is the operational core of most crop-based FPOs. At harvest, the FPO operates a primary processing center (PPC) that receives produce from members, grades it, and stores it for market sale. Rung 3 covers:
– Member-wise produce receipt: quantity, grade, moisture, impurity level, and receiving date
– Weighbridge integration (where automated weighbridges are in use)
– Quality grading records: MSP-grade versus below-MSP separation, and the basis for each
– Storage management: which lot is in which warehouse bay, with entry date and expected outdate
– Member account crediting: provisional payment based on receipt, with final settlement after market sale
A state-level FPO federation in Maharashtra we worked with, aggregating grain procurement across 47 affiliated member organizations, was running Rung 3 operations entirely through WhatsApp messages between cluster coordinators and a central operations manager. Procurement data reached a shared spreadsheet two to three days after each collection cycle. By the time the data was consolidated, the market window for forward sales had often already closed. Rung 3 automation cut that lag to under four hours.
Rung 4: Market Linkage
At Rung 4, the FPO’s output aggregation connects to market platforms. This includes:
– e-NAM integration: listing warehouse-verified produce on the Electronic National Agriculture Market for price discovery and buyer discovery
– ONDC integration: for direct-to-consumer or direct-to-processor sales outside APMC channels
– Forward contract management: tracking advance payment commitments from institutional buyers against expected delivery lots
– Commodity price feed integration: live mandi prices from AgMarknet, state APMC APIs, or commodity exchanges for informed sale timing
Rung 5: Financial Services Integration
At Rung 5, the FPO’s operational data becomes the basis for financial product access:
– Kisan Credit Card (KCC) eligibility verification: member land holding and crop data from AgriStack
– PM-KISAN beneficiary verification: ensuring members who are PM-KISAN recipients are correctly enrolled and cross-referenced
– FPO-level working capital credit: lender API integration for collateral-free loans to the FPO entity based on aggregated procurement receipts
Rung 5 is where the FPO becomes a financial entity, not just an operations collective. This is where institutional credit at meaningful scale becomes accessible.
The Data Quality Problem Nobody Mentions
Bharat-VISTAAR is designed to give farmers AI-generated crop management advice by integrating AgriStack data, ICAR research packages, weather data, and market price signals. The framing positions it as government AI talking to farmers directly.
The problem is that Bharat-VISTAAR’s advisory output reaches individual farmers most effectively when it is actionable at the FPO level: which members should shift to a specific variety this season, what input procurement should the FPO plan for, which members are at credit risk from a poor yield forecast.
For Bharat-VISTAAR to be operationally useful to an FPO, the FPO needs software that can consume advisory signals and map them to operational decisions. That is not a government platform problem. It is an FPO ERP problem.
Bharat-VISTAAR is government AI talking to farmers. FPO ERP is the operational layer that makes the conversation actionable.
What This Means for Agriculture Leaders
The most valuable action an FPO CEO or board can take this week is a member registry audit: compare the FPO’s current member list against the AgriStack Farmer IDs available for verification in the state portal. The gap between registered members and FID-verified members is a proxy for the data quality problem across every subsequent operational rung.
FPO software is not a technology problem. It is an institutional design problem with a technology component. The institutions are now in place: 10,000 FPOs, the AgriStack identity layer, and Bharat-VISTAAR’s advisory intelligence. The software that connects operations to infrastructure has a ten-year window to become the backbone of Indian agricultural commerce.
The FPOs that build that software in 2026 will be the ones accessing institutional credit in 2027 and setting commodity prices in 2028.
About the author: The Codelynks engineering team has delivered custom enterprise systems for agricultural, cooperative, and rural commerce platforms across India. Connect on LinkedIn.
FAQ’s
1. What is AgriStack and why does it matter for FPO software? AgriStack is India’s digital public infrastructure for agriculture, including a Farmer Registry that assigns a unique Farmer ID (FID) to every Indian farmer, linked to their Aadhaar, land records, and bank account. For FPO software, the FID is the anchor for member verification, eliminating ghost members and enabling direct financial product access.
2. What is Bharat-VISTAAR? Bharat-VISTAAR (Virtually Integrated System to Access Agricultural Resources) is a multilingual AI advisory platform announced in the Union Budget 2026-27. It integrates AgriStack data with ICAR crop research packages to provide farmers with tailored advice on crop planning, pest management, weather, and market prices. It operates in Hindi, English, and will expand to eleven languages within six months.
3. What is the FPO Digital Integration Ladder (FDIL)? FDIL is a five-rung framework for building operational ERP capabilities for farmer producer organizations. The rungs are member registry (Rung 1), input management (Rung 2), output aggregation (Rung 3), market linkage including e-NAM and ONDC (Rung 4), and financial services integration including KCC and NABARD schemes (Rung 5).
4. What is e-NAM and how does it connect to FPO operations? e-NAM (Electronic National Agriculture Market) is the central government’s online trading platform for agricultural commodities. FPOs can list warehouse-verified produce on e-NAM for competitive price discovery across buyers in multiple states, removing dependence on local mandi intermediaries. e-NAM integration at Rung 4 of FDIL is the primary market linkage tool for grain and horticulture FPOs.
5. How many FPOs are registered in India, and what percentage have operational software? India has 10,000 registered Farmer Producer Organizations as of 2026, having met the government’s PM FPO scheme target. Industry estimates suggest fewer than 15% of these FPOs have operational software (ERP or equivalent) that connects their procurement and output aggregation workflows to digital records, with the remainder relying on WhatsApp-based coordination, manual registers, or spreadsheets.
SAP S/4HANA Migration for Manufacturers has become one of the most urgent ERP modernization initiatives facing the manufacturing sector. SAP ends mainstream maintenance for ECC 6.0 on December 31, 2027. After that date, security patches, legal change packages, and quality fixes stop unless the customer pays for extended maintenance.Organizations planning large-scale ERP modernization initiatives with expert IT consulting support should begin with a structured assessment and roadmap. Learn more about our Enterprise Modernization Services.
SAP S/4HANA Migration for Manufacturers requires early planning because ERP modernization projects often take 18 to 36 months to complete.
SAP S/4HANA Migration for Manufacturers: Why the 2027 Deadline Matters
The 2027 deadline is not a support contract issue. It is a security vulnerability accumulation timeline.
After December 2027, SAP will not release security patches for ECC. Zero-day vulnerabilities identified in 2028, 2029, and 2030 will not be fixed. Extended maintenance covers critical legal and regulatory changes required for specific geographies and industries but not security vulnerabilities. A manufacturing ERP managing production orders, supplier invoices, and quality records for an ISO 9001-certified facility running on unpatched software is operating outside its own compliance framework.
The resource problem compounds this. The pool of qualified SAP S/4HANA migration consultants both functional and technical is finite. As the 2027 deadline forces the remaining 60 percent of ECC customers to begin their migrations simultaneously, the consultant market will tighten significantly. Teams starting their SAP migration in Q4 2026 are not late they are competing for the same consultant pool as the teams that should have started in 2024. The difference is they have less negotiating leverage on timelines and rates.
There is one viable path for a manufacturer starting now: a scoped, phased migration that puts the highest-risk modules in production before December 2027 and manages the rest under extended maintenance.
Why High-Mix Manufacturing Makes SAP Migration Harder Than IT Estimates
High-mix manufacturing environments, those producing many product variants at low-to-medium volumes accumulate SAP customizations over years of use. Production planning (PP), materials management (MM), quality management (QM), and warehouse management (WM) modules are heavily customized to support the plant’s specific scheduling constraints, quality inspection workflows, batch traceability requirements, and work center configurations.
Standard migration assessment tools count configuration objects and estimate effort in person-days. They typically undercount the production planning customizations that manufacturing teams have built to manage constraints the standard SAP PP module does not handle well: sequence-dependent setups, capacity buckets defined by tooling availability rather than work center capacity, scheduling rules that reflect machine-specific cycle times recorded in operations outside SAP.
High-mix manufacturing does not have a standard migration template. Every production planning customization your team built in ECC is a decision you will make again in S/4HANA.The biggest challenge in SAP S/4HANA Migration for Manufacturers is balancing operational continuity with modernization goals.
A mid-size auto-components manufacturer we work with in Pune had 47 custom ABAP programs supporting production scheduling and quality reporting. Their IT team’s initial migration estimate, based on object count alone, projected a 14-month migration. When we mapped those 47 programs against S/4HANA’s standard capabilities, we found that 12 of them addressed gaps that S/4HANA closes natively (particularly in Advanced Planning and Optimization, which is now embedded in S/4HANA as PP/DS). The remaining 35 still required migration decisions: redevelop in ABAP, replace with a standard S/4HANA configuration, or replace with a third-party add-on. That mapping exercise alone added six weeks to the scoping phase and produced a materially different cost estimate and a more accurate timeline.
The Manufacturing Migration Decision Framework (MMDF)
The MMDF is a structured decision tool for manufacturing organizations evaluating SAP migration options. It evaluates four module groups across two axes: business criticality (how central is this module to daily manufacturing operations?) and migration complexity (how heavily customized is this module relative to the S/4HANA standard?).
Apply the MMDF to each module group before committing to a migration approach.A structured framework can significantly reduce risk during SAP S/4HANA Migration for Manufacturers by identifying high-complexity modules early.
Module Group 1: Finance and Controlling (FI/CO)
This is the lowest-complexity module group for most manufacturers because S/4HANA’s financial architecture (Universal Journal, merged FI and CO) is significantly cleaner than ECC’s. Most manufacturers should migrate FI/CO first, in the initial go-live wave. This module group typically drives the business case and is the focus of accelerated migration tools.
Module Group 2: Procurement and Materials Management (MM/SRM)
Medium complexity. Vendor master, purchasing, inventory management, and invoice verification are well-supported in S/4HANA. Source determination and supplier scheduling agreements often carry customizations. Evaluate against S/4HANA standard before assuming custom redevelopment is necessary.
Module Group 3: Production Planning and Quality Management (PP/QM)
Highest complexity for high-mix manufacturers. PP/DS (embedded Advanced Planning) replaces APO in S/4HANA, but the migration from ECC PP with custom scheduling logic to PP/DS requires a functional redesign, not a technical lift-and-shift. QM batch classification, inspection plan migration, and usage decision workflow customizations are consistently underestimated.
Module Group 4: Warehouse Management (WM to EWM)
WM module is deprecated in S/4HANA. The replacement is Extended Warehouse Management (EWM). This is not a configurationmigration;n it is a system replacement. EWM has a fundamentally different data model, warehouse structure definition, and task management approach. Plan for a parallel run period of three to six months if your warehouse operations are complex.
Classify each module group on the MMDF grid. High-criticality, high-complexity modules (typically PP/QM for manufacturers) require the most detailed scoping and should have dedicated functional resources independent of the core migration team.
odule readiness with go/no-go decision criteria. See Codelynks’ [enterprise software modernization services](/services/enterprise-modernization) for more on how we structure manufacturing ERP migrations.*
The Hidden Costs: EWM, PP/DS, and QM in Manufacturing SAP Migrations
Three cost categories consistently exceed initial estimates in manufacturing SAP migrations:
EWM implementation: Most ECC manufacturing clients are on WM, not EWM. The S/4HANA migration requires an EWM implementation, not a WM migration. For a facility with a complex put-away strategy, multi-step goods receipt, or cross-docking operations, EWM implementation is a separate project workstream that should be scoped and staffed independently. Budget 20 to 30 percent of the overall migration budget for EWM, separate from the core FI/CO and MM migration.
PP/DS redesign: Moving from ECC PP with custom scheduling to S/4HANA PP/DS requires a functional architect who understands both systems and the plant’s production constraints. The redesign work is primarily functional, not technical. The risk is mapping business rules embedded in custom ABAP programs to PP/DS configuration without losing the scheduling logic those programs encoded.
Data migration for manufacturing objects: Production orders, inspection lots, batch master records, and classification data are substantially more complex to migrate than financial master data. Quality inspection results linked to specific batches, work center calendars mapped to specific shift patterns, and BOM variants for high-mix product families all require extraction rules, transformation logic, and validation criteria that are specific to the plant’s operational history.
What to Prepare Before Your First SAP S/4HANA Conversation
Before engaging an SAP system integrator or scheduling discovery calls with SAP directly, complete the following internally:
Custom code inventory: Pull the complete list of custom ABAP programs, user exits, BAdIs, and Z-transactions in your ECC system. Sort by module and by usage frequency (transaction code usage can be extracted from SAP system logs). This inventory is the primary input to a realistic migration estimate.
Module customization map: For each major module (FI, CO, MM, PP, QM, WM), document the three to five customizations that are most operationally significant. Not every customization in the systemthe ones that, if they disappeared, would break daily operations within 24 hours.
Data volume and retention requirements: Total record counts for production orders, inspection lots, and batch records. Retention requirements for quality documents (ISO 9001 typically mandates seven years). This determines whether a full historical data migration is required or whether a data archiving strategy can reduce migration scope.
Business continuity constraints: Identify the blackout periods when a production ERP cutover is not feasible peak production quarters, customer delivery commitments, audit periods, and budget cycles. The migration timeline must be built around these constraints, not the other way around.
What This Means for Manufacturing Leaders
The organizations that will complete their SAP S/4HANA migration before the December 2027 deadline are the ones that start the scoping work now not the system integration engagement, but the internal preparation that makes a realistic scoping engagement possible. The biggest challenge in SAP S/4HANA Migration for Manufacturers is balancing operational continuity with modernization goals.
The concrete steps you can take this week: run the ABAP custom code report in your ECC system and get a count of custom programs by module. If you are above 100 custom programs in production-related modules, your migration timeline is almost certainly in the 24 to 36 month range. That means your go-live must be planned before December 2027, which means your project start must be before Q1 2025 which, for teams reading this now, has already passed.
The question that determines your path forward is not whether to migrate. It is which modules to migrate by December 2027 and which to manage under extended maintenance while a second migration wave completes.
Successful SAP S/4HANA migration for manufacturers depends on accurate custom code assessment, realistic timelines, and phased implementation strategies.
About the author: The Codelynks enterprise modernization team has scoped and delivered SAP migrations for manufacturers in India and Southeast Asia across auto components, consumer electronics, and process industries. Connect on LinkedIn.
Conclusion
SAP S/4HANA Migration for Manufacturers is no longer a future planning exercise. With SAP ECC support ending in 2027, manufacturers must evaluate custom code, production planning dependencies, warehouse management requirements, and migration timelines now to avoid unnecessary risk and cost.
FAQ’s
What happens to SAP ECC after the December 2027 mainstream maintenance deadline?
This is one of the primary reasons SAP S/4HANA Migration for Manufacturers has become a strategic priority before the 2027 deadline.
How long does a full SAP S/4HANA migration take for a mid-size manufacturer?
A full migration from ECC to S/4HANA for a mid-size manufacturer (500 to 2,000 users, multiple plants) typically takes 18 to 36 months, depending on custom code volume, number of modules in scope, and data migration complexity.
Can we do a phased SAP migration and still meet the 2027 deadline?
Yes. A phased approach migrating FI/CO and core MM in a first wave, then PP/QM and EWM in a second wave is a viable strategy. The first wave must go live before December 2027 to eliminate the highest-risk systems from the unsupported state. The second wave can complete under extended maintenance.
What happens to SAP ECC after the December 2027 mainstream maintenance deadline?
WM (Warehouse Management) is deprecated in S/4HANA. EWM (Extended Warehouse Management) is the replacement. This is not a configuration migration it is a system replacement with a different data model, warehouse structure definition, and task management approach. Plan for three to six months of parallel operations during cutover.
How do we estimate our SAP migration effort before engaging a system integrator?
Pull a custom ABAP program inventory by module. Map critical customizations in PP, QM, and WM against S/4HANA standard capabilities. Document your data volumes for production orders, inspection lots, and batch records. This internal preparation produces a far more realistic estimate than a standard discovery call.
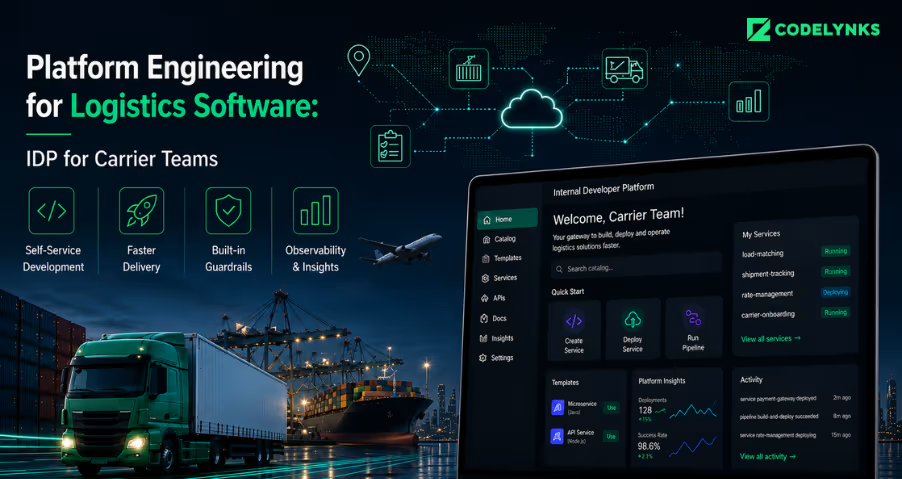
Platform engineering for logistics software has become essential as logistics technology companies scale carrier integrations across regions and partners. As integration complexity grows, internal developer platforms (IDPs) help engineering teams standardize onboarding, improve reliability, and accelerate deployments.
A logistics technology company managing shipments across fifteen carriers and four geographies does not have a DevOps problem. It has a product problem: the internal tooling its developers use to build, test, and deploy carrier integrations has become as complex as the customer-facing product. When new carrier onboarding takes three weeks because the engineer who wrote the last integration is the only one who knows the pattern that is a platform problem
When a hotfix to a rate calculator breaks a different carrier’s label generation because both modules share the same deployment pipeline that is a platform problem. When your senior engineers spend Thursdays rotating through integration support tickets that is a platform problem. Platform engineering is the discipline of treating your internal development infrastructure as a product built for your engineers. In logistics software, that is no longer optional.
Platform Engineering Challenges in Logistics Software
Every carrier integration is a distributed system you did not choose to build. It has an authentication mechanism (API key, OAuth, mTLS). It has rate limits and retry semantics that differ from every other carrier. It has a webhook payload format that does not match your internal event schema. It has an SLA for responses that you are now implicitly underwriting.
At three to five integrations, a senior developer’s institutional knowledge is sufficient. At ten, you need patterns and shared libraries. At twenty, you need a platform, a self-service layer that encapsulates those patterns and lets a developer onboard a new carrier without knowing how the previous twenty were built.
A cross-border logistics operator we work with in East Africa reached thirty-two active carrier integrations before they acknowledged the problem. At that point, the on-call rotation included a weekly “carrier health check” where a developer manually validated that each integration was functioning, because there was no unified observability layer to tell them otherwise. The senior engineer running that check was spending roughly eight hours per week on it. The team had also stopped onboarding new carriers because the estimated effort per integration had grown from four days to three weeks as the codebase had accumulated undocumented variation.
The solution was not a new carrier integration tool. It was a platform that encoded what “a working carrier integration” actually meant: a standard interface adapter, a shared retry library, a unified event schema, and an integration health dashboard that flagged anomalies automatically. Once those existed, onboarding a new carrier took four days again.
The Cost of No Platform: What Logistics Software Teams Actually Spend on Toil
Platform engineering literature quotes a 30 to 40 percent cognitive load reduction as the standard benefit of a well-built IDP. In logistics software, the specific cost centers are more concrete:
Carrier integration onboarding time: Without a platform, each new carrier integration is a research project. A developer must discover the carrier’s API documentation, implement an adapter from scratch, wire it into the existing routing logic, and validate it against the carrier’s sandbox. With a platform that includes a standard carrier adapter interface and a scaffold generator, the same task is a configuration exercise.
Environment provisioning: Logistics software typically runs multiple environments per carrier partnership during onboarding. Without self-service infrastructure, each new environment is a Jira ticket to the DevOps team. The median wait time at a ten-person engineering team is two to three days.
Integration debugging: When a carrier integration fails in production, the mean time to diagnosis depends entirely on what is logged and how. Without a standard logging schema across all carrier adapters, diagnosing an issue requires reading each adapter’s bespoke logging output which often does not include the correlation IDs needed to trace a specific shipment event.
Deployment coordination: Logistics software changes are often time-sensitive a rate change or service window update from a carrier needs to be in production before the next booking cycle. Without a reliable CI/CD pipeline with clear environment promotion gates, urgent changes get deployed manually, bypassing the testing stage.
If your senior engineers are the people who know how to wire a new carrier, you have a knowledge problem masquerading as a platform problem.
Logistics Platform Engineering Maturity Model
The LPEL describes four levels of platform maturity for logistics software teams. Each level is achievable independently and adds compounding value.
Level 1 standardized carrier adapter interface. A typed interface (or abstract class, or contract test suite) that defines what a compliant carrier adapter must implement: `getRate()`, `createShipment()`, `getStatus()`, `cancelShipment()`, `parseWebhook()`. Every carrier adapter implements this interface. The routing logic only ever calls the interface. New carrier integrations are additions, not modifications to the core.
Level 2 shared reliability primitives. A library that provides retry logic with exponential backoff, circuit breakers, and timeout configuration as configurable parameters rather than custom implementations. Carrier-specific retry policies are configuration, not code. The library also provides a standard logging schema that all adapters use, enabling a unified observability layer above the adapter level.
Level 3 Self-service environment provisioning. Developers can spin up a new environment (staging, carrier-specific sandbox, load test environment) via a CLI command or a portal action without a DevOps ticket. Environments are defined as code, provisioned from templates, and torn down automatically after a defined period. This requires a functioning Kubernetes cluster and a Terraform or Pulumi module library for logistics service dependencies.
Level 4 Unified integration health dashboard. A single view of integration health across all carrier adapters: current status, error rate (last one hour, last 24 hours), latency percentiles (p50, p95, p99), and active circuit breaker states. Alerts are rule-based: an error rate above 2% on a carrier adapter pages the on-call engineer. The integration health dashboard is the tool that replaces the manual Thursday health check.
Core Components of a Logistics Internal Developer Platform
The developer portal is not the platform. The platform is the set of capabilities the portal exposes. Build the capabilities first.
What belongs in the platform:
The standard carrier adapter interface and its validation test suite
The shared reliability library (retry, circuit breaker, timeout, logging schema)
The CI/CD pipeline templates for carrier integration services (build, test, deploy to staging, promote to production)
The environment provisioning automation (IaC templates for common logistics service topologies)
The observability stack configuration (metrics collection, alerting rules, integration health dashboard)
What does not belong in the platform at first:
Carrier-specific business logic (that belongs in the adapter, not the platform)
Rate optimization algorithms (application code, not infrastructure)
The customer-facing tracking UI (product, not platform)
The boundary matters because platform teams build infrastructure that other teams depend on — similar to how managed services teams operate. If business logic leaks into the platform, changes to business requirements become platform changes, which require coordination with every team that depends on the platform. That coordination overhead defeats the point of having a platform.
Backstage, Custom, or Buy: Making the Portal Decision for Logistics
Once Levels 1 through 3 of the LPEL are in place, a developer portal becomes the UI layer that makes the platform’s capabilities discoverable and usable. The three credible choices are:
Backstage (CNCF): The strongest choice for teams that already run Kubernetes and have at least one engineer willing to own Backstage plugins. The catalog, scaffolding templates, and TechDocs integration are genuinely useful for logistics teams managing dozens of carrier integrations. Backstage plugin development has a learning curve; plan for eight to twelve weeks to reach a useful internal deployment.
Port or Cortex: Faster to stand up than Backstage, with SaaS hosting removing the operational burden. Good for teams that want a developer portal in weeks rather than months. Less flexible for custom logistics-specific workflows. The per-seat pricing model becomes meaningful at forty-plus engineers.
Custom portal: Appropriate only if your carrier integration patterns are unusual enough that standard portal scaffolding tools cannot represent them, or if your security requirements prohibit SaaS. Building a custom portal before building the underlying platform capabilities is the most common mistake we see.
What This Means for Logistics Technology Leaders
The logistics software market is consolidating around companies that can integrate with any carrier, any geography, and any customs system without a multi-week engineering project per new partner. That capability is a platform problem. You build it once and it compounds.
The concrete steps you can take this week: count how many carrier integrations are in production. Count how long the last three carrier onboarding projects took from kickoff to production. If the number is growing and the time is growing, the problem will not solve itself. Map your integration codebase against the LPEL Level 1 definition. If you do not have a standard adapter interface, that is the first thing to build and it typically takes two to three weeks with a single senior engineer.
About the author: The Codelynks platform engineering team has built carrier integration platforms and internal developer platforms for logistics and e-commerce operators across Africa, Southeast Asia, and the Middle East. Connect on LinkedIn
FAQ’s
What is an internal developer platform (IDP) for logistics software?
An IDP is a self-service layer built by a platform engineering team that abstracts away infrastructure complexity carrier integration patterns, CI/CD pipelines, environment provisioning so that application developers can ship new carrier integrations and features without depending on specialist knowledge or DevOps tickets.
At what point does a logistics software team need platform engineering?
The inflection point is typically ten to fifteen carrier integrations. Before that, shared documentation and code standards are sufficient. After that, the accumulation of variation in how each integration was built creates coordination overhead that only a platform can resolve.
Should we use Backstage for our logistics developer portal?
Backstage is the strongest choice for teams running Kubernetes with an engineer willing to own it. If you need a portal in under three months and cannot staff a Backstage engineer, Port or Cortex are faster to deploy. Build the platform capabilities (adapter interface, shared libraries, IaC templates) before choosing the portal tool.
How long does it take to build a standard carrier adapter interface?
Two to three weeks for a senior engineer to design and implement the interface, write the contract test suite, and refactor two or three existing carrier adapters to conform. The investment pays back within the first new carrier onboarding that follows.
What is the single most valuable first investment in logistics platform engineering?
A standard carrier adapter interface with a contract test suite. It costs two to three weeks and immediately caps the complexity of every future carrier integration.
A national omnichannel retailer in India came to Codelynks with a specific problem: their “real-time inventory” system was 47 minutes stale at peak, which meant their BOPIS (buy online, pick up in store) promise was failing one in four customers during sale events. They had Apache Kafka feeding a mature data warehouse. They had a data engineering team that understood both tools. The problem was not their tooling. The problem was that they had built a streaming ingestion layer on top of a batch table format, and the two had incompatible consistency models.
The inventory data was arriving continuously via Kafka. The warehouse was processing it in micro-batches every 90 seconds. During peak transaction hours, warehouse file compaction paused to handle query load, micro-batches accumulated in the staging layer, and inventory data fell 30 to 50 minutes behind. Adding more Kafka consumers made it worse. Every additional consumer increased write volume on the warehouse, which extended compaction time, which increased the lag.
This is the pattern we see in retail data platforms that were designed before Apache Iceberg became operational. The 2026 architecture question is no longer whether to adopt Iceberg. It is how to run it as a production product at retail transaction volumes without recreating the same bottleneck.
Why Real-Time Inventory Fails Before You Add More Kafka Workers
Batch ETL pipelines were designed for end-of-day inventory reconciliation. When retail moved to omnichannel with POS systems, warehouse management, e-commerce, and marketplace feeds all updating inventory simultaneously the batch model was stretched past its operating range without a fundamental architecture change.
The write amplification problem: every small write to a data warehouse creates a new file. At 10,000 POS transactions per hour across 200 stores, that is a continuous stream of small files landing in the storage layer. Traditional data warehouses and first-generation data lakes handle this by compacting files in background jobs that consolidate many small files into fewer large ones. When compaction is running, query performance degrades. When query load spikes (during a sale), compaction is deprioritized, files accumulate, and read performance worsens. The cycle repeats.
Apache Iceberg breaks this cycle at the format level. Iceberg tables use a metadata layer that tracks file-level statistics, partition snapshots, and row-level deletes without rewriting entire files. A write to an Iceberg table creates a new snapshot that references changed files it does not invalidate existing query plans. This means concurrent reads and writes do not compete in the same way they do on a traditional warehouse table. Deletion vectors (introduced in Iceberg v3, now in public preview on Databricks as of May 2026) extend this to row-level updates: a position delete can be applied without a full file rewrite.
Your inventory data is 47 minutes stale not because you lack Kafka workers, but because your table format was designed for nightly batch loads.
What Apache Iceberg v3 Changes for Retail Data Teams
Databricks released Apache Iceberg v3 to public preview in May 2026. Three features matter specifically for retail inventory architecture.
Deletion vectors at scale: Previous Iceberg versions handled row deletes via position delete files, which required merge-on-read at query time for high-delete-rate tables. V3 deletion vectors batch these efficiently, reducing the merge-on-read overhead for tables that receive continuous CDC (change data capture) updates. For a retail inventory table with thousands of position updates per minute, this changes the cost model for real-time ingestion.
Row lineage: Iceberg v3 tracks the origin of every row through insert, update, and delete operations. For a retailer running BOPIS and ship-from-store, this enables exact inventory attribution when an item is reserved, deducted, restocked, or returned, the full lineage is queryable without a separate audit table.
Improved manifest handling for high-partition tables: Retail inventory tables are typically partitioned by store ID, SKU category, and date. At 5,000 stores and 200,000 SKUs, partition count is high. V3 manifest improvements reduce the metadata scan cost for queries against recent partitions, which is where inventory freshness queries always land.
None of these features eliminate the need for compaction. They reduce the frequency and cost of compaction relative to previous Iceberg versions and relative to traditional warehouse formats.
The Retail Data Freshness Ladder (RDFL)
The RDFL is a four-tier framework for measuring and targeting inventory data latency across retail data platforms. Each tier has a technical definition, a business implication, and an architecture requirement.
Tier 1: Batch (Latency: 4 to 24 hours)
Data arrives via nightly ETL from ERP, WMS, and POS systems. Appropriate for financial reconciliation, vendor purchase order generation, and historical analytics. Insufficient for any customer-facing inventory display. Architecture: standard data warehouse, no streaming.
Tier 2: Near Real-Time (Latency: 5 to 30 minutes)
Micro-batch ingestion from core systems. Data is fresh enough for replenishment triggers and back-office dashboards. Not reliable for BOPIS promise fulfillment during peak events. Architecture: streaming pipeline feeding a warehouse with micro-batch load intervals. This is where most omnichannel retailers sit today.
Tier 3: Operational Real-Time (Latency: 30 seconds to 5 minutes)
CDC-based ingestion from POS, WMS, and e-commerce via Kafka into Iceberg tables with frequent small-file compaction. Meets the latency requirement for BOPIS promise fulfillment and omnichannel inventory display. Architecture: Kafka + CDC connectors (Debezium) feeding Iceberg tables via a streaming SQL engine (Flink or Spark Structured Streaming), with a REST Catalog for query engine access.
Tier 4: Sub-Second Inventory (Latency: under 5 seconds)
Required only for high-velocity SKUs during flash sale events. Typically achieved by running a Redis or DynamoDB materialized view for hot SKUs alongside the Iceberg lakehouse for cold catalog. Architecture: dual-tier with cache invalidation driven by Kafka events and Iceberg as the source of truth for reconciliation.
Most national omnichannel retailers need Tier 3 for their BOPIS and omnichannel use cases. Tier 4 is a specialized layer for peak event handling, not a general architecture.
The retailer we worked with was operating at Tier 2 and needed Tier 3. The migration required three changes: replacing their micro-batch loader with Flink-based CDC ingestion, converting their inventory tables from Parquet-on-S3 to Iceberg format (a one-time migration that took 6 days for 18 months of history), and deploying a REST Catalog to unify access across their BI queries (Trino), ML pipelines (Spark), and operational dashboards (DuckDB via their internal API).
For teams evaluating data architecture options for retail platforms, see our [data engineering practice overview](/services/data-engineering) for how we approach lakehouse migrations.
The Architecture That Resolves Write Amplification
A national omnichannel retailer in India came to Codelynks with a specific problem: their “real-time inventory” system was 47 minutes stale at peak, which meant their BOPIS (buy online, pick up in store) promise was failing one in four customers during sale events. They had Apache Kafka feeding a mature data warehouse. They had a data engineering team that understood both tools. The problem was not their tooling. The problem was that they had built a streaming ingestion layer on top of a batch table format, and the two had incompatible consistency models.
The inventory data was arriving continuously via Kafka. The warehouse was processing it in micro-batches every 90 seconds. During peak transaction hours, warehouse file compaction paused to handle query load, micro-batches accumulated in the staging layer, and inventory data fell 30 to 50 minutes behind. Adding more Kafka consumers made it worse. Every additional consumer increased write volume on the warehouse, which extended compaction time, which increased the lag.
This is the pattern we see in retail data platforms that were designed before Apache Iceberg became operational. The 2026 architecture question is no longer whether to adopt Iceberg. It is how to run it as a production product at retail transaction volumes without recreating the same bottleneck.
Why Real-Time Inventory Fails Before You Add More Kafka Workers
Batch ETL pipelines were designed for end-of-day inventory reconciliation. When retail moved to omnichannel with POS systems, warehouse management, e-commerce, and marketplace feeds all updating inventory simultaneously the batch model was stretched past its operating range without a fundamental architecture change.
The write amplification problem: every small write to a data warehouse creates a new file. At 10,000 POS transactions per hour across 200 stores, that is a continuous stream of small files landing in the storage layer. Traditional data warehouses and first-generation data lakes handle this by compacting files in background jobs that consolidate many small files into fewer large ones. When compaction is running, query performance degrades. When query load spikes (during a sale), compaction is deprioritized, files accumulate, and read performance worsens. The cycle repeats.
Apache Iceberg breaks this cycle at the format level. Iceberg tables use a metadata layer that tracks file-level statistics, partition snapshots, and row-level deletes without rewriting entire files. A write to an Iceberg table creates a new snapshot that references changed files; it does not invalidate existing query plans. This means concurrent reads and writes do not compete in the same way they do on a traditional warehouse table. Deletion vectors (introduced in Iceberg v3, now in public preview on Databricks as of May 2026) extend this to row-level updates: a position delete can be applied without a full file rewrite.
Your inventory data is 47 minutes stale not because you lack Kafka workers, but because your table format was designed for nightly batch loads.
What Apache Iceberg v3 Changes for Retail Data Teams
Databricks released Apache Iceberg v3 to public preview in May 2026. Three features matter specifically for retail inventory architecture.
Deletion vectors at scale: Previous Iceberg versions handled row deletes via position delete files, which required merge-on-read at query time for high-delete-rate tables. V3 deletion vectors batch these efficiently, reducing the merge-on-read overhead for tables that receive continuous CDC (change data capture) updates. For a retail inventory table with thousands of position updates per minute, this changes the cost model for real-time ingestion.
Row lineage: Iceberg v3 tracks the origin of every row through insert, update, and delete operations. For a retailer running BOPIS and ship-from-store, this enables exact inventory attribution when an item is reserved, deducted, restocked, or returned, the full lineage is queryable without a separate audit table.
Improved manifest handling for high-partition tables: Retail inventory tables are typically partitioned by store ID, SKU category, and date. At 5,000 stores and 200,000 SKUs, partition count is high. V3 manifest improvements reduce the metadata scan cost for queries against recent partitions, which is where inventory freshness queries always land.
None of these features eliminate the need for compaction. They reduce the frequency and cost of compaction relative to previous Iceberg versions and relative to traditional warehouse formats.
The Retail Data Freshness Ladder (RDFL)
The RDFL is a four-tier framework for measuring and targeting inventory data latency across retail data platforms. Each tier has a technical definition, a business implication, and an architecture requirement.
Tier 1: Batch (Latency: 4 to 24 hours)
Data arrives via nightly ETL from ERP, WMS, and POS systems. Appropriate for financial reconciliation, vendor purchase order generation, and historical analytics. Insufficient for any customer-facing inventory display. Architecture: standard data warehouse, no streaming.
Tier 2: Near Real-Time (Latency: 5 to 30 minutes)
Micro-batch ingestion from core systems. Data is fresh enough for replenishment triggers and back-office dashboards. Not reliable for BOPIS promise fulfillment during peak events. Architecture: streaming pipeline feeding a warehouse with micro-batch load intervals. This is where most omnichannel retailers sit today.
Tier 3: Operational Real-Time (Latency: 30 seconds to 5 minutes)
CDC-based ingestion from POS, WMS, and e-commerce via Kafka into Iceberg tables with frequent small-file compaction. Meets the latency requirement for BOPIS promise fulfillment and omnichannel inventory display. Architecture: Kafka + CDC connectors (Debezium) feeding Iceberg tables via a streaming SQL engine (Flink or Spark Structured Streaming), with a REST Catalog for query engine access.
Tier 4: Sub-Second Inventory (Latency: under 5 seconds)
Required only for high-velocity SKUs during flash sale events. Typically achieved by running a Redis or DynamoDB materialized view for hot SKUs alongside the Iceberg lakehouse for cold catalog. Architecture: dual-tier with cache invalidation driven by Kafka events and Iceberg as the source of truth for reconciliation.
Most national omnichannel retailers need Tier 3 for their BOPIS and omnichannel use cases. Tier 4 is a specialized layer for peak event handling, not a general architecture.
The retailer we worked with was operating at Tier 2 and needed Tier 3. The migration required three changes: replacing their micro-batch loader with Flink-based CDC ingestion, converting their inventory tables from Parquet-on-S3 to Iceberg format (a one-time migration that took 6 days for 18 months of history), and deploying a REST Catalog to unify access across their BI queries (Trino), ML pipelines (Spark), and operational dashboards (DuckDB via their internal API).
The Architecture That Resolves Write Amplification
The core architecture for Tier 3 retail inventory:
The CDC connector (Debezium) reads the POS database binlog and WMS transaction log and publishes events to Kafka topics partitioned by store ID. A Flink job consumes these events, applies deduplication (a POS system may emit the same transaction event twice during a network retry), and writes directly to Iceberg tables using the Flink-Iceberg connector.
The Iceberg table for inventory positions uses a schema designed for CDC: the primary key is (store_id, sku_id), and the table uses merge-on-read semantics so that updates do not require rewriting the entire partition file. A compaction job runs on a 10-minute schedule outside of peak query windows, consolidating small files and cleaning deletion vectors.
A REST Catalog (Apache Polaris or managed equivalents on Databricks Unity Catalog or AWS Glue) provides a single governance layer. Every query engine Trino for BI queries, Spark for ML training pipelines, and the application API for real-time inventory checks reads from the same Iceberg metadata. Access controls are enforced at the catalog layer, not replicated across engines.
Compaction is the tax you pay for real-time writes. The teams that plan for it ship. The teams that discover it in production rebuild.
Operational Realities: Compaction, Catalog Governance, and the Multi-Engine Tax
The hardest part of running Iceberg at retail scale is not turning it on. It is running ingestion and compaction as a managed product.
Compaction must be scheduled, not run on-demand. A compaction job that kicks off during peak query hours degrades read performance. Most teams learn this at 3 a.m. on the day after their first sale event, when compaction from the sale’s write volume collides with the next morning’s BI jobs.
The multi-engine lakehouse where Flink, Trino, DuckDB, and Spark all read the same Iceberg tables requires centralized governance. Without a REST Catalog with role-based access control, each engine maintains its own metadata cache, which diverges under concurrent writes. The REST Catalog serializes metadata access and ensures every engine sees a consistent snapshot.
The counterintuitive number from the retailer engagement: migrating to Iceberg reduced their total storage cost by 31% within 90 days because Iceberg’s partition pruning eliminated the full-scan queries that were driving object storage egress charges. The real-time improvement was the headline goal. The storage savings paid for the migration.
What This Means for Retail and E-commerce Leaders
If your BOPIS cancel rate spikes during sale events, or if your inventory display accuracy drops below 95% during peak traffic, the architecture fix is almost certainly a move from Tier 2 to Tier 3 on the RDFL. The migration path is documented, the tooling is production-grade, and the operational requirements are understood.
Three steps you can take this week:
1. Measure your actual inventory data latency at peak. Not the theoretical pipeline interval the measured staleness between a POS transaction and the moment the inventory count changes in your e-commerce system. If you do not have this measurement, instrument it before any architecture discussion.
2. Ask your data engineering team whether your current inventory tables are stored in Iceberg, Delta Lake, Hudi, or a traditional Parquet-based warehouse format. If the answer is the latter, that is your write amplification source.
3. Check whether your compaction jobs have a scheduled window that does not overlap with your peak query hours. Most teams have compaction running as a continuous background process which means it always runs during peak.
The tooling is not the obstacle. Apache Iceberg is free, the Flink connector is production-grade, and REST Catalog is available as a managed service on every major cloud. The obstacle is building compaction and catalog governance as a product, not an afterthought.
CDC connector (Debezium) reads the POS database binlog and WMS transaction log and publishes events to Kafka topics partitioned by store ID. A Flink job consumes these events, applies deduplication (a POS system may emit the same transaction event twice during a network retry), and writes directly to Iceberg tables using the Flink-Iceberg connector.
The Iceberg table for inventory positions uses a schema designed for CDC: the primary key is (store_id, sku_id), and the table uses merge-on-read semantics so that updates do not require rewriting the entire partition file. A compaction job runs on a 10-minute schedule outside of peak query windows, consolidating small files and cleaning deletion vectors.
A REST catalog (Apache Polaris or managed equivalents on Databricks Unity Catalog or AWS Glue) provides a single governance layer. Every query engine, Trino for BI queries, Spark for ML training pipelines, and the application API for real-time inventory checks, reads from the same Iceberg metadata. Access controls are enforced at the catalog layer, not replicated across engines.
Compaction is the tax you pay for real-time writes. The teams that plan for it ship. The teams that discover it in production rebuild.
Operational Realities: Compaction, Catalog Governance, and the Multi-Engine Tax
The hardest part of running Iceberg at retail scale is not turning it on. It is running ingestion and compaction as a managed product.
Compaction must be scheduled, not run on-demand. A compaction job that kicks off during peak query hours degrades read performance. Most teams learn this at 3 a.m. on the day after their first sale event, when compaction from the sale’s write volume collides with the next morning’s BI jobs.
The multi-engine lakehouse where Flink, Trino, DuckDB, and Spark all read the same Iceberg tables requires centralized governance. Without a REST Catalog with role-based access control, each engine maintains its own metadata cache, which diverges under concurrent writes. The REST Catalog serializes metadata access and ensures every engine sees a consistent snapshot.
The counterintuitive number from the retailer engagement: migrating to Iceberg reduced their total storage cost by 31% within 90 days because Iceberg’s partition pruning eliminated the full-scan queries that were driving object storage egress charges. The real-time improvement was the headline goal. The storage savings paid for the migration.
What This Means for Retail and E-commerce Leaders
If your BOPIS cancel rate spikes during sale events, or if your inventory display accuracy drops below 95% during peak traffic, the architecture fix is almost certainly a move from Tier 2 to Tier 3 on the RDFL. The migration path is documented, the tooling is production-grade, and the operational requirements are understood.
Three steps you can take this week:
1. Measure your actual inventory data latency at peak. Not the theoretical pipeline interval the measured staleness between a POS transaction and the moment the inventory count changes in your e-commerce system. If you do not have this measurement, instrument it before any architecture discussion.
2. Ask your data engineering team whether your current inventory tables are stored in Iceberg, Delta Lake, Hudi, or a traditional Parquet-based warehouse format. If the answer is the latter, that is your write amplification source.
3. Check whether your compaction jobs have a scheduled window that does not overlap with your peak query hours. Most teams have compaction running as a continuous background process which means it always runs during peak.
The tooling is not the obstacle. Apache Iceberg is free, the Flink connector is production-grade, and REST Catalog is available as a managed service on every major cloud. The obstacle is building compaction and catalog governance as a product, not an afterthought.
About the author: The Codelynks data engineering team designs and migrates retail data platforms for omnichannel operators across India and Southeast Asia. [Connect on LinkedIn](https://www.linkedin.com/company/codelynks).*
FAQ’s
What is Apache Iceberg and why does it matter for retail inventory data?
Apache Iceberg is an open table format for large-scale analytical datasets. Unlike traditional Parquet-based warehouse tables, Iceberg uses a metadata layer that enables ACID-compliant transactions, concurrent reads and writes without conflicts, and efficient row-level updates. For retail inventory data that changes continuously across POS, WMS, and e-commerce systems, these properties reduce data staleness from minutes to seconds.
What is write amplification in a retail data platform?
Write amplification occurs when a streaming workload generates more write operations than the underlying storage format can compact efficiently. In retail, high-frequency POS and WMS events create many small files. When the system cannot compact these files fast enough, read queries slow down and inventory latency increases. Apache Iceberg’s deletion vectors and snapshot isolation architecture reduce write amplification compared to traditional warehouse formats.
What is the Retail Data Freshness Ladder (RDFL)?
The RDFL is a four-tier framework developed by Codelynks for measuring and targeting inventory data latency. Tier 1 is batch (4 to 24 hours), appropriate for financial reconciliation. Tier 2 is near real-time (5 to 30 minutes), common in most omnichannel retailers today. Tier 3 is operational real-time (30 seconds to 5 minutes), the target for BOPIS fulfillment reliability. Tier 4 is sub-second, a specialized layer for flash sale peak events.
How long does it take to migrate an existing retail data warehouse to Apache Iceberg?
For a warehouse with 12 to 24 months of inventory history, the table migration (converting existing Parquet tables to Iceberg format) typically takes 5 to 8 days of elapsed time, including validation. The pipeline migration (replacing batch loaders with CDC-based Flink ingestion) takes 4 to 8 weeks depending on the number of source systems. Total migration timeline for a national retailer with 10 to 20 core data sources is typically 10 to 14 weeks.
What is the role of a REST Catalog in a retail Iceberg lakehouse?
A REST Catalog (such as Apache Polaris or managed equivalents like Databricks Unity Catalog or AWS Glue) provides a centralized metadata governance layer for Iceberg tables. It ensures that multiple query engines, Flink for ingestion, Trino for BI queries, and Spark for ML pipelines, see a consistent view of the same Iceberg tables, with access controls enforced centrally rather than replicated per engine.
OTT platform content security DRM is no longer limited to encrypting video streams — a challenge best addressed with a strong cybersecurity strategy. Modern piracy groups target the license layer, extract keys from memory, and redistribute premium content through Telegram and piracy networks within hours of release. A regional OTT platform in South Asia was spending $340,000 per year on Widevine L1 licensing.
In the twelve months before they engaged Codelynks, their premium titles appeared on Telegram within 4 to 6 hours of release consistently, across every major release event. Their DRM was functioning correctly. Their content was still leaking. The problem was not their Widevine configuration. The problem was that Widevine L1 protects content in transit and during playback on hardware-backed devices. It does not protect the license key once it has been issued to a device, and it does not protect content once a key has been extracted from the player’s memory.
In March 2026, the US Supreme Court ruled that internet service providers are not liable for their users’ copyright infringement. For OTT platforms, the practical effect is that the organizational and financial responsibility for anti-piracy enforcement now sits entirely with the platform. The ruling did not create the piracy problem. It clarified who has to solve it.
How Does DRM Key Extraction Actually Work?
Modern DRM systems Widevine, FairPlay, PlayReady operate correctly. They encrypt content during transit and enforce playback policies at the device level. The security boundary they protect is the transmission channel. What they were not designed to protect is the license key after it has been delivered to the device.
DRM key extraction exploits the gap between license delivery and playback. The attack approach: a modified player application requests a legitimate license from the content platform’s license server, receives the decryption key, and extracts that key from the device’s process memory before it is consumed by the DRM subsystem. Widevine L1 provides hardware-backed key storage on supported devices, which raises the cost of extraction significantly. Widevine L3, the software-only fallback used on most non-Widevine-certified hardware, has no hardware protection boundary.
The practical result: a single key extraction from an L3 device is sufficient to decrypt and re-encode the content at scale. The extracted key can be used to produce a clean, DRM-free copy of the title, which is what appears on Telegram channels within hours of release.
Organized piracy groups stopped cracking DRM two years ago. They extract keys from RAM. If your security model is ‘we have Widevine L1’, you are defending the wrong perimeter.
Multi-DRM systems (serving Widevine, FairPlay, and PlayReady from a single license server) address device coverage but do not close the key extraction vector. The attack surface that matters in 2026 is the license layer the gap between key issuance and playback and this is where most OTT platforms are underinvested.
What the Supreme Court Ruling Changes for South Asian OTT Operators?
The ruling’s implications are clearest in the US market, but South Asian OTT operators cannot treat this as a foreign policy development. The ruling creates a global reference point: ISPs have no duty to block infringing content on their networks. Anti-piracy enforcement is the platform’s responsibility, not the infrastructure’s.
For regional platforms in India, Sri Lanka, Bangladesh, and Southeast Asia, this accelerates a trend that was already underway: the shift from passive content protection (DRM licensing, geo-blocking) to active enforcement (forensic watermarking, automated Telegram monitoring, DMCA-equivalent takedown workflows).
The ISP liability ruling also affects how studios and content distributors negotiate licensing agreements. Platforms without demonstrable anti-piracy architecture are facing tighter content licensing terms, shorter license windows, and in some cases, conditional approvals that require documented security postures before premium content licenses are granted.
The OTT Content Defense Stack (OCDS): A Four-Layer Framework
The OCDS organizes content protection into four coordinated layers. The important word is coordinated each layer addresses one attack vector, and a platform relying on any single layer is leaving the others exposed.
Layer 1: Access Control
JWT authentication with short-lived tokens (15-minute expiry), signed streaming URLs bound to device ID and IP, concurrent stream limits enforced at the session level, and rate limiting on license requests. This layer prevents credential sharing and blocks bulk license harvesting. Exit criterion: no single credential can be used to generate more than N simultaneous streams, and every license request is authenticated against a live session token.
Layer 2: Encryption and DRM
Multi-DRM deployment serving Widevine (L1 mandatory for premium content, L3 not accepted on content with theatrical window), FairPlay for iOS, and PlayReady for Windows. License server configured with minimum license duration (24 hours maximum for subscription content, 48 hours for rental), output protection flags set for HDCP enforcement, and key rotation for live streams. Exit criterion: all premium content served behind Widevine L1 or FairPlay. L3 devices receive SD quality maximum for content within the theatrical window.
Layer 3: Deterrence (Forensic Watermarking)
Session-level forensic watermarks embedded in the video stream. Each playback session receives a unique invisible identifier at the user, device, and timestamp level. The identifier survives screen recording, re-encoding, and format conversion. If content appears on Telegram, the watermark is extracted and the exfiltration source is identified to the specific account and session. Exit criterion: 100% of premium content carries a session-unique forensic watermark before delivery.
Layer 4: Detection and Response
Automated monitoring of Telegram channels, piracy websites, and torrent indexes for titles within their license window. Watermark extraction on identified pirated content to trace the source. Automated takedown workflows (DMCA and regional equivalents). Account suspension for confirmed exfiltration sources. Exit criterion: mean time to detection for a new infringing copy of a premium title is under 6 hours, with automated takedown initiated within 2 hours of detection.
DRM protects content in transit. It does not protect content in the player’s memory, and that is where the breach happens.
A platform operating all four layers is what the industry now calls a proactive enforcement posture. A platform operating only Layers 1 and 2 which describes most regional OTT operators is running a passive posture against an adversary that has already moved past the defenses being invested in.
Forensic Watermarking: What It Does and Where It Breaks
Forensic watermarking embeds a viewer-specific identifier into the video bitstream at the encoding or packaging stage. Unlike visible watermarks (which degrade user experience and can be cropped), forensic marks are invisible and designed to survive aggressive post-processing: compression, resizing, color grading, and re-encoding at different bitrates.
The identifier is unique at the session level. This means two users watching the same title at the same time receive different bitstreams, each with a different embedded code. When pirated content surfaces, the watermark is extracted and matched against a database of issued codes to identify the specific playback session.
The failure modes to understand:
Collusion attacks: Multiple users compare their streams and compute the differences, then produce a version that obscures the watermark. Most current forensic watermarking systems are designed to resist collusion among up to 10 to 20 users. Attacks requiring 100+ collaborators are impractical at scale for most regional platforms.
Latency impact: Session-level watermark embedding adds encoding latency. For live sports, this must be implemented in the packaging layer (Just-in-Time packaging), not the encoding layer, to stay within acceptable stream delay.
False negatives in compressed formats: Very aggressive re-encoding (below 500 Kbps for HD content) can degrade watermark readability. Threshold detection requires calibration specific to your encoding parameters.
For platforms evaluating forensic watermarking vendors, Codelynks maintains an independent assessment framework. See our [cybersecurity practice overview](/services/cybersecurity) for how we approach vendor evaluation for content protection.
Building the Stack in the Right Order
The sequencing matters. Teams that deploy forensic watermarking before tightening access control are watermarking content that leaks through credential sharing and watermark extraction on a shared account returns a real user, who may be innocent. The correct build order follows the OCDS layer sequence: access controls first, DRM configuration second, forensic watermarking third, automated detection fourth.
For the South Asia platform we worked with, the engagement had four phases over 18 weeks. Layer 1 tightening (concurrent stream limits, token rotation) reduced Telegram leak volume by 40% before any watermarking was deployed credential sharing, not key extraction, was the dominant leak channel for that platform. Layer 3 forensic watermarking identified the remaining sources within the first three weeks of deployment. The $340,000 Widevine spend was not wasted. It was necessary but insufficient.
What This Means for Media and Entertainment Leaders
The March 2026 ruling set an expectation the studios and licensing bodies were already moving toward: OTT platforms are responsible for their own enforcement, and that responsibility requires demonstrable architecture, not a DRM license certificate.
Three actions you can take this week:
1. Review your current license server configuration. Check the token expiry duration and concurrent stream limit settings. If your tokens last longer than 30 minutes or you have no concurrent stream cap, you have credential sharing exposure that forensic watermarking will not close.
2. Ask your DRM vendor what percentage of your subscriber devices are using Widevine L3 rather than L1. For premium content within theatrical windows, L3 device access should be restricted to SD resolution at maximum.
3. Search Telegram for your platform name or the title of your most recent major release. The result will tell you whether you have an active leak problem and roughly how quickly content is surfacing after release.
A coherent four-layer stack does not cost more than a poorly configured three-layer one. Most of the investment is in architecture decisions, not vendor spend.
About the author: The Codelynks cybersecurity team designs content security architectures for streaming platforms and digital media operators across South Asia and Southeast Asia.
Does Widevine L1 protect against OTT content piracy?
Widevine L1 provides hardware-backed key storage and protects content during transit and playback on certified devices. It does not protect against DRM key extraction from the player’s memory, which is the primary attack vector used by organized piracy operations in 2026. L1 is necessary but not sufficient as a standalone content security measure.
What is forensic watermarking in OTT streaming?
Forensic watermarking embeds an invisible, unique identifier into each viewer’s video stream at the session level. The identifier survives screen recording, re-encoding, and format conversion. If pirated content surfaces, the watermark is extracted to identify the specific account, device, and session that produced the leak.
How did the March 2026 US Supreme Court ISP ruling affect OTT platforms?
The ruling held that ISPs are generally not liable for copyright infringement by their users. For OTT platforms, this places the full burden of anti-piracy detection, enforcement, and takedown on the platform itself. It also establishes a reference point that content licensors and studios are using to require demonstrable security architectures from regional platforms.
What is the OTT Content Defense Stack (OCDS)?
The OCDS is a four-layer content protection framework developed by Codelynks: Layer 1 (Access Control), Layer 2 (Encryption and DRM), Layer 3 (Forensic Watermarking), and Layer 4 (Detection and Response). Each layer addresses a distinct attack vector. Effective content protection requires all four layers operating in coordination.
How quickly should an OTT platform detect pirated copies of its content?
Industry benchmark for proactive enforcement posture is detection within 6 hours of a pirated copy appearing, with automated takedown initiated within 2 hours of detection. Platforms at this posture rely on automated monitoring of Telegram channels, piracy websites, and torrent indexes manual monitoring cannot achieve these response times at catalog scale.
Android Automotive OS fleet app development is becoming a major priority for EV fleet operators after Google’s AAOS SDV release in 2026. As automotive software shifts from infotainment systems to software-defined vehicle platforms, fleet operators must rethink how driver apps handle VHAL integration, OTA updates, lifecycle management, and compliance requirements. On March 24, 2026, Google announced it is open-sourcing the Android Automotive OS SDV platform a version of AAOS that extends beyond the infotainment screen to manage climate, lighting, cameras, diagnostics, and vehicle telemetry at the systems level.
Coverage of the announcement focused on what Renault was doing with it and whether Qualcomm’s Snapdragon Digital Chassis would be the dominant hardware platform. Ride-hailing operators and EV fleet managers in India and Southeast Asia should be asking a different question: when your driver-facing app moves from the driver’s phone to the vehicle’s instrument cluster and sits adjacent to systems that control physical actuators, what breaks first?Android Automotive OS fleet app development is becoming critical for EV fleet operators adopting AAOS SDV platforms.
A ride-hailing fleet operator we work with in India has 1,400 EVs on the road. Their driver app a React Native build that handles navigation, ride assignment, battery status, and shift management runs on a mounted Android phone in the vehicle. It has a 99.3% crash-free rate and a median session duration of 9 hours without restart. The team initially treated the AAOS SDV migration as a port. It was not. It was a platform replacement.
What Google Actually Open-Sourced (And What It Changes)
Previous versions of AAOS were focused on infotainment: maps, media, phone. The SDV extension moves the operating system into the vehicle’s functional architecture. Google’s post described a “compact, performant and scalable software foundation based on a headless Android native stack” that extends into seat actuators, instrument clusters, climate control, lighting, cameras, and diagnostics.
The key architectural change is the topology-agnostic communication layer. Traditional automotive architecture runs dozens of isolated electronic control units (ECUs) from different suppliers, each running proprietary software. AAOS SDV provides a unified layer that consolidates these ECU functions under a single Android-based operating system with support for granular OTA updates.
For fleet operators, this means the vehicle software stack including the layers your app will run alongside can be updated over the air. That sounds like a feature. It is also a regression vector.
AAOS SDV is not a bigger infotainment screen. It is an operating system that now sits between your fleet app and the vehicle’s physical actuators.
What the Old Fleet App Model Assumed
Android Auto and phone-based fleet apps operated on a clean separation of concerns: the vehicle did vehicle things, the app did app things. The VHAL (Vehicle Hardware Abstraction Layer) provided a read-only interface to vehicle properties like speed, gear, and charging status. Your app consumed data. It did not control anything.
AAOS SDV changes that boundary. An app running natively on the AAOS SDV platform can with appropriate permissions interact with the vehicle’s functional systems.
For fleet apps, this creates both capability and responsibility. Applications now operate closer to vehicle telemetry, diagnostics, and functional systems.
The practical implications for fleet developers include permissions management, UI rendering constraints, and lifecycle handling across ignition, sleep, and OTA update cycles.
Why Android Automotive OS Fleet App Development Is Changing EV Fleets
Permissions are now safety-critical: Requesting access to vehicle properties on AAOS SDV is not like requesting camera permission on a phone. VHAL permissions in the SDV context are safety-classified. Misconfigured permission scopes can be grounds for OEM integration rejection.
UI rendering constraints are stricter: The Driver Distraction Guidelines for AAOS set limits on text length, interactive elements, and screen transitions while the vehicle is in motion. A fleet app that displays 8 data fields on the ride assignment screen will fail compliance review.
Lifecycle management is different: AAOS SDV apps must handle vehicle lifecycle events ignition on/off, battery critical, system sleep :that do not exist in the phone app model. A background service that behaves correctly on Android 15 may hold the system awake during vehicle shutdown on AAOS SDV.
The Vehicle Integration Maturity Model (VIMM) : The VIMM is a four-level framework for assessing where a fleet app team sits on the readiness scale for AAOS SDV integration. Each level has defined capabilities and blockers.
Level 1: Phone-Mounted (Current State for Most Fleets): App runs on a mounted Android phone or tablet. Reads vehicle data via OBD-II dongle or fleet telematics SDK. No native AAOS integration. Blocker for advancement: the team has no AAOS development environment and no VHAL test interface.
Level 2: Android Auto Compatible:App meets Android Auto Driver Distraction Guidelines. Navigation, communication, and status functions work on Android Auto projection. Vehicle data is read-only via VHAL. Most established fleet apps reach Level 2 within one sprint of focused work. Blocker for advancement: no Vehicle Data API integration for SDV-specific properties.
Level 3: AAOS Native (Infotainment): App runs natively on AAOS, not projected from a phone. Uses AAOS-specific lifecycle events and CarAppService APIs. Handles ignition and sleep transitions. Passes OEM UI compliance review. This is where most fleet platforms should be targeting in 2026. Blocker for advancement: OEM hardware access for integration testing.
Level 4: AAOS SDV Integrated:App accesses SDV-specific properties charging session management, diagnostic event streams, climate state, camera feeds for monitoring. Participates in OTA update topology. Has a tested rollback strategy for OEM-initiated system updates. This level requires an active partnership with the OEM or Tier-1 supplier and is appropriate only for fleet operators with direct vehicle manufacturing relationships.
Most ride-hailing and delivery fleet operators should be targeting Level 3 in their 2026 roadmaps. Level 4 is for the Renaults of the world.
Key Technical Decisions When Building on AAOS SDV
Choose between Car App Library and fully native AAOS: Google’s Car App Library (available since Android 11) handles Driver Distraction compliance automatically and supports Android Auto projection as well as AAOS native. It is the right choice for most fleet apps because it separates layout from compliance. Going fully native gives you more control but requires manual compliance audit for every UI change.
Design your data sync architecture for vehicle connectivity patterns: A vehicle moving through an urban route has intermittent LTE. Your sync strategy cannot assume continuous connectivity. Background sync with conflict resolution and local-first data models are required for ride assignment and status updates.
Test on real AAOS hardware, not the emulator: The AAOS emulator does not accurately simulate VHAL property timing, sleep/wake transitions, or the rendering pipeline on actual automotive-grade displays. Hardware testing is not optional before OEM submission.
Build your OTA update strategy before the first production deployment: AAOS SDV supports granular OTA updates the OEM can push a system update that changes VHAL behavior while your app is running. Without a tested compatibility check and rollback procedure, the next OEM firmware push can break your fleet app on every vehicle simultaneously.
The open-source release did not lower the barrier to vehicle integration. It shifted who owns the liability when the integration goes wrong.
For teams beginning AAOS SDV evaluation, our [mobile engineering capability overview](/services/mobile-engineering) covers how we approach connected vehicle app development for fleet operators.
What Fleet Operators Underestimate About OTA Updates?
In the phone app world, you control your update schedule. A bug in version 3.2.1 gets patched in 3.2.2 and the user updates within 48 hours. In the AAOS SDV world, your app shares an update channel with the vehicle’s operating system, and the OEM controls that channel.One of the biggest risks in Android Automotive OS fleet app development is handling OTA updates and VHAL compatibility changes.
A system update from the OEM can change VHAL property IDs, deprecate APIs your app depends on, or modify the permission model for safety-critical properties. If your app is tightly coupled to specific VHAL property versions, an OEM system update breaks your fleet at scale. Decoupling your VHAL property access behind an abstraction layer with a version compatibility matrix and graceful degradation for missing properties is not premature optimization. It is the minimum viable architecture for production vehicle integration.
The fleet operator we work with in India learned this during their AAOS Level 3 migration. A preproduction OEM firmware update deprecated two VHAL properties their app used for battery status. The abstraction layer they had built as a precaution meant the app fell back to the telematics SDK for that data and continued functioning. The alternative was a field update to 1,400 vehicles.
What This Means for Automotive and Fleet Leaders?
If your driver-facing app runs on a mounted phone today, the migration to AAOS native is not urgent but scoping it is. The in-vehicle apps market is growing from $79 billion in 2026 to over $190 billion by 2034, and OEMs are consolidating around AAOS SDV as the standard platform. Fleets that migrate early establish integration credentials with OEMs. Fleets that wait migrate under deadline pressure.Successful Android Automotive OS fleet app development requires lifecycle-aware architecture and real hardware testing.
Three steps you can take this week:
1. Assess your current app against the AAOS Driver Distraction Guidelines. Count how many UI elements would fail the motion-state restrictions. That count is your Level 2 gap.
2. Ask your engineering team whether your VHAL property access is abstracted or hardcoded. If it is hardcoded, scope the abstraction layer work before any OEM conversation.
3. Contact the OEM for your EV fleet and ask for the AAOS integration program documentation. Most OEMs have a defined submission process. Understanding that timeline sets your actual delivery deadline.
The AAOS SDV platform is open-source as of this year. The barrier to starting is a development environment, not a licensing fee. The barrier to shipping is a safety audit, and that has always been there.
Conclusion
Android Automotive OS fleet management app development will become a core investment area for EV fleet operators adopting AAOS SDV platforms.Companies investing early in Android Automotive OS fleet app development will gain long-term advantages in connected vehicle ecosystems.
About the author: The Codelynks mobile engineering team builds connected vehicle and fleet management applications for ride-hailing and logistics operators across India and Southeast Asia.
FAQ ‘s
What is Android Automotive OS SDV and how is it different from Android Auto?
Android Auto is a projection system it mirrors a phone app onto a car’s infotainment screen. Android Automotive OS (AAOS) runs natively on the vehicle’s hardware. The SDV (Software Defined Vehicle) extension announced by Google in March 2026 goes further, enabling AAOS to manage vehicle systems beyond infotainment including climate, lighting, cameras, and diagnostics.
Do I need to rewrite my fleet app to support AAOS SDV?
Not necessarily a full rewrite, but a significant port. Apps running on Android phones must be adapted to AAOS lifecycle events, Driver Distraction Guidelines, and VHAL property access patterns. Google’s Car App Library reduces this work for apps targeting Level 2 and Level 3 of the Vehicle Integration Maturity Model.
What are the AAOS Driver Distraction Guidelines?
These are OEM-enforced rules that limit UI complexity while the vehicle is in motion: maximum text length, restricted interactive elements, and limited number of list items displayed simultaneously. Apps must comply to pass OEM submission review. The Car App Library handles most of this automatically.
How do OTA updates work for fleet apps on AAOS SDV?
AAOS SDV supports granular OTA updates managed by the OEM. A system update can change VHAL property behaviors or APIs without your app’s involvement. Fleet apps must abstract VHAL property access and implement graceful degradation to survive OEM-initiated system updates without breaking in production.
What is the VIMM (Vehicle Integration Maturity Model)?
The VIMM is a four-level framework developed by Codelynks for assessing fleet app readiness for AAOS SDV integration. Level 1 is phone-mounted (no native integration). Level 2 is Android Auto compatible. Level 3 is AAOS native on the infotainment system. Level 4 is full AAOS SDV integration with access to vehicle functional systems. Most fleet operators should target Level 3 in 2026.
Bima Sugam API integration is becoming one of the most important technology priorities for Indian insurers in 2026. Every insurer in India has nine months to build the same API. Most Will Build It Wrong. Bima Sugam Phase 2 goes live in three waves: motor insurance in July 2026, health in August, and life in September. By the time the third wave lands, every insurer licensed in India will need a functional integration with India’s national digital insurance infrastructure. The Bima Sugam India Federation (BSIF) is co-creating the integration handbook with nearly 150 industry representatives right now. That handbook will become the compliance benchmark. Insurers who wait for the final draft before starting will spend Q4 2026 in emergency remediation.
A composite InsurTech platform we worked with approached Bima Sugam integration early, in Q4 2025, treating it as an API product build rather than a regulatory task. The architectural decisions they made in month one are still standing without major revision. The decisions their competitors made in month four are already costing them rework.
This post covers what an API integration layer for Bima Sugam actually looks like at the infrastructure level, where most teams underestimate the complexity, and the five-rung ladder we use to assess whether an insurer is ready to go live.
What Bima Sugam Actually Requires from Your API Layer
Bima Sugam is not a portal integration. It is a standardized API ecosystem, modeled explicitly on UPI’s interoperability architecture, where every participating insurer exposes and consumes a defined set of endpoints covering policy comparison, purchase, renewal, portability, claims intimation, and eventually, health data exchange with hospitals and TPAs.
Phase 1, already live for select products, covers policy issuance and renewal. Phase 2 adds claims intimation, third-party integrations (hospitals and TPAs), health data APIs, and portability workflows. The technical surface area roughly triples between phases.
The authentication model is OAuth 2.0 with certificate-based mutual TLS at the transport layer. Every API call carries a correlation ID. Every response requires idempotency guarantees. The latency requirements for policy status checks are under 300 milliseconds at the 95th percentile. These are not aspirational targets. They will be audited.
Most insurers have existing core systems, policy administration platforms, and CRM tools that were not built with any of this in mind.
The Integration Patterns That Actually Work : There are three patterns in use across the market.
Direct adapter pattern: The insurer builds a thin translation layer that maps Bima Sugam’s API schemas to their internal system schemas. Low upfront cost. High maintenance cost. Every schema change in either system creates a breaking change in the adapter.
Event-driven middleware pattern: An integration bus (Apache Kafka or AWS EventBridge are common choices) sits between the Bima Sugam gateway and internal systems. API calls trigger events. Internal systems subscribe. This pattern handles the Phase 2 claims and TPA flows well because claims processing is inherently asynchronous. The bus absorbs volume spikes, and each downstream system can evolve independently.
API gateway with contract testing: A dedicated API gateway layer manages versioning, rate limiting, and schema validation before traffic reaches internal systems. Contract tests run on every deployment. This pattern costs the most to set up but produces the most stable integration over a 24-month lifecycle.
The InsurTech platform we worked with started with the direct adapter pattern for speed, then migrated to event-driven middleware when Phase 2 scope became clear. The migration cost roughly six weeks of engineering time. Teams that start with the gateway pattern avoid that rework entirely.
Where the Complexity Is Hiding
The BSIF technical specifications describe the API contract clearly. The complexity lives in the gaps between your Bima Sugam integration and every other system it touches.
Policy data normalization: Your internal policy records carry legacy field names, nullable fields in places Bima Sugam expects required fields, and date formats that do not match the ISO 8601 standard the platform requires. Data normalization before the API layer is not optional.
Embedded insurance flows: Embedded insurance is growing at 46% annually in India. Bima Sugam’s APIs are designed to feed into third-party checkout flows, whether that is a vehicle purchase platform, a travel booking engine, or a lending app. Your Bima Sugam API must also work inside these partner flows without custom builds for each partner. That requires a documented API facade, not just a working internal integration.
Claims event choreography: Phase 2 claims intimation requires your API to accept a claim event from Bima Sugam, validate it against your policy records, acknowledge receipt within a defined SLA, and then trigger your internal claims workflow. Any failure in that sequence is a regulatory event, not just a technical failure.
An API that passes the BSIF compliance check but breaks inside your embedded partner’s checkout is not an integration. It is a liability.
The Insurance API Readiness Ladder (IARL): We use a five-rung assessment to determine where an insurer actually stands before integration work begins. Each rung must be stable before the next one is worth building.
Rung 1: Catalog Alignment: All active product schemas are documented in a machine-readable format (OpenAPI 3.x). Field names, data types, and nullability are verified against current system behavior, not historical documentation.
Rung 2: Authentication and Identity: OAuth 2.0 authorization flows are tested. mTLS certificates are provisioned for production and staging. Token refresh logic handles edge cases (expiry during long transactions, concurrent requests).
Rung 3: Core Transaction APIs: Policy comparison, purchase, and renewal endpoints are live and passing BSIF sandbox tests. Latency is within SLA at projected load. Idempotency keys are implemented across all state-changing operations.
Rung 4: Event-Driven Claims: Claims intimation events are consumed from the Bima Sugam event stream. Internal claims workflows are triggered asynchronously. Dead-letter queues and retry logic handle transient failures without data loss.
Rung 5: Health Data and TPA Integration: Health data APIs are integrated with at least two TPA partners. Hospital discharge summaries, diagnostic reports, and billing data flow through the claims pipeline without manual intervention.
Most insurers we assess are between Rung 2 and Rung 3 as of Q2 2026. Phase 2 requires Rung 4 for health and motor launches. Teams building from Rung 1 in May have a realistic path to Rung 4 by August if they treat it as an engineering program, not a procurement exercise.
The Embedded Insurance Opportunity Nobody Is Pricing In : Here is the part most integration teams are not tracking. Bima Sugam compliance is not just a cost center. The same API layer that satisfies BSIF requirements is the infrastructure for distributing embedded insurance products through fintech apps, OTAs, and digital lending platforms.
Embedded insurance is already growing faster than any standalone channel in India. The platforms that will capture that growth are the ones that expose clean, documented, low-latency APIs. Those APIs are exactly what Bima Sugam compliance forces you to build.
The insurer who treats this as an audit task ships a compliance adapter. The insurer who treats this as a distribution platform ships an API that their embedded partners will prefer over every competitor.
Most insurers are optimizing for the audit. The ones who pull ahead will optimize for the consumer journey.
Need Help With This?
The Codelynks engineering team has designed and shipped API integration platforms for financial services and InsurTech clients across India and the GCC. Connect on LinkedIn
FAQ’s
What is Bima Sugam and which insurers must integrate with it?
Bima Sugam is India’s national digital insurance marketplace built on standardized APIs, mandated by IRDAI. Every insurer licensed in India must integrate. Phase 2 covers health, motor, and life segments, with launches between July and September 2026.
What APIs does Bima Sugam Phase 2 require?
Phase 2 adds claims intimation, health data exchange with hospitals and TPAs, portability workflows, and third-party embedded distribution APIs on top of the Phase 1 policy issuance and renewal endpoints.
How long does Bima Sugam API integration take for a mid-size insurer?
A team of four to six engineers working from a stable policy administration system can complete a Phase 2-compliant integration in approximately 16 weeks. Teams without documented internal APIs should add 4 to 6 weeks for normalization work.
Can the same API layer support both BSIF compliance and embedded insurance?
Yes. The Bima Sugam API contracts are designed for interoperability. The same endpoints that satisfy BSIF can be exposed to embedded partners in fintech apps, lending platforms, and OTAs with minimal additional work.
What authentication standard does Bima Sugam use?
Bima Sugam uses OAuth 2.0 with certificate-based mutual TLS at the transport layer. All state-changing operations require idempotency keys.
The importance of documentation in software development cannot be overstated. While high-quality code forms the foundation of any software project, effective documentation ensures that developers, stakeholders, and end users can understand, maintain, and efficiently use the system.
Good documentation improves collaboration, simplifies onboarding, supports scalability, and helps teams maintain long-term project quality. In this article, we explore 10 reasons why documentation matters and share practical tips for writing effective technical documentation.
Importance of documentation
Improved Code Readability and Understanding: The most significant benefit of documentation is the improvement of the readability and intelligibility of code. While well-structured code can often speak for itself, thorough documentation allows developers, especially those new to a project, to quickly understand what it does, its structure, and its functionality. This highlights the technical documentation for every developer in a project.
Comment: Code comments explain tricky logic; complement them with extrinsic documents to describe high-level architecture or workflows.
Easier Onboarding for New Developers: An adequately documented codebase makes easy the bringing in of new people and getting them up to speed. The absence of documentation might take weeks or even days for newcomers to just decipher code, hence delaying the project and increasing the possibility of mistakes. Documentation gives this roadmap, clarifying more about the project quickly and letting them get on with their job efficiently. Understanding the software documentation here ensures smoother onboarding.
Tip: Have a README file giving a high-level overview of the project and including all the essential setup instructions, key dependencies, and architecture of the project.
Supports Future Code Maintenance: For collaborative software, team members have to keep on working on each other’s code. Without proper documentation, there will be miscommunication and misunderstanding, hence calling for otherwise unnecessary exchange. Good documentation ensures that all the members are oriented with the code and they work very well together. This further emphasizes the project documentation in teamwork.
Tip: Apply a style guide to write documentation consistently across your team to attain clarity and consistency.
Helps Future Code Maintenance: Codebases become more difficult to maintain as projects grow and evolve. Without some documentation, developers may forget why certain decisions were made or how specific components of the code interact. A reference point in the form of documentation helps maintainers know where the original design came from so they can make informed updates or fixes., showing the importance of documentation in long-term maintenance.
Tip: Document key design decisions and architectural patterns such that future developers will understand the reasoning behind specific implementation choices.
Reduces Dependency on Critical Experts: In many projects, there are just a few individuals who become experts in something. In addition, this creates a bottleneck, and if these individuals leave the project or are unavailable, this puts the project in jeopardy. This is because documentation decentralizes knowledge available to the team as a whole, highlighting the importance of documentation for team resilience.
Tip: Encourage a culture where every team member is responsible for documenting his or her contributions and updates.
Improves API Usability: For APIs or developer tool-based projects, this kind of documentation is crucial. Without proper API documentation, the users might not understand the way they need to implement and use your software, bringing frustration and higher support requests. This reinforces the importance of documentation in API development.
Tip: Use tools like Swagger and Postman to automatically generate API documentation and keep it fresh and easy to navigate.
Helps with Debugging and Testing: Good documentation helps developers find and correct bugs rapidly should such problems arise. Proper information about known limitations and specific component behaviors documented throughout the codebase provide diagnostics in solving problems, showing again the importance of documentation for debugging
Tip: Document typical error cases, exceptions, and debugging tips so that developers don’t have to rewrite everything.
Ensures Compliance and Security: For industries that have a sense of regulatory compliance, such as in healthcare, finance, or the government, documentation may be a legal necessity. Proper documentation could support compliance with industry standards, security measures, and also with the set of laws, which could save you from fines and laws, emphasizing the importance of documentation in regulated environments.
Tip: Update your documentation at regular intervals to reflect changes in regulation and ensure that your project remains compliant and secure.
Facilitates Scalability of the Project: As software projects are becoming increasingly complex and large in scope, the documentation needs to increase. Documentation is required for scalability as it makes the codebase scale in size without sacrificing usability. Good documentation provides a scalable foundation for adding features and expanding services. scalability goes a long way when it’s good in the documentation. This further shows the importance of documentation for long-term growth.
Tip: Document in such a way that when the codebase is scaled, it remains modular and structured but without going on to overwhelm the developer as well.
Supports Project Scalability : Poor documentation is among the numerous reasons a software project becomes obsolete. When the new developer cannot make sense of the project, or the original developers move on, the change becomes hard to maintain and expand. With good documentation, your project thrives even after the initial team has moved on.
Tip: Use version control for documentation and update it according to current developments within the project, making it long-liveable.
Conclusion
Effective documentation plays a critical role in the success of software projects. From improving collaboration and onboarding to supporting scalability and long-term maintenance, well-structured documentation helps teams work more efficiently and deliver higher-quality software products.
Organizations that invest in technical documentation practices benefit from better knowledge sharing, faster issue resolution, and more scalable development processes.
In today’s fast-evolving digital landscape, DevOps security and compliance is no longer optional but essential for modern organizations. The move, especially in this fast-paced digital era, seems to make alignment of DevOps and compliance a necessity rather than an option. Organizations increasingly embrace DevOps methodologies. Integrating security and compliance into DevOps increases agility while reducing risk and meeting stringent regulations.
In this article, we will be discussing seven key practices in ensuring security as well as regulatory compliance for a DevOps environment.
7 Best Practices for DevOps Security and Compliance in 2025
Adopt DevSecOps: Security as a Built-in Component : Traditionally, these security practices usually cause bottlenecks in these development cycles. DevSecOps incorporates security into the pipeline of DevOps. This way, each step, be it writing code or even in production, will adhere to regulations. It means that security is shared between both the development and operations teams.
Security can be put in place very early in the development lifecycle where vulnerabilities are detected early, and subsequently, the final product is compliance-compliant. Organizations improve performance significantly by adopting strong DevOps security and compliance practices.
Compliance through Security Tools Automation: Automation has significant impacts on how management is approached to secure either security automation or compliance. Automated tools will indeed enforce policies, thus checking the codes against predefined standards at every step of the build process.
All of these tests use automated security testing and compliance tools: this ensures continuous scanning for potential compliance issues, reducing the chance of non-compliance. For example, usage of a CI/CD pipeline might make it possible to utilize automated vulnerability scanning tools that quite simplify compliance checks.
Continuous Integration and Continuous Compliance Monitoring : Continuous monitoring helps maintain DevOps security and compliance and reduces regulatory risk. Combining that with continuous compliance monitoring enables all the code changes to be in tune with security policy and regulatory frameworks.
With these best practices in place, organizations ensure a trail of auditability of compliance-related actions that further ease reporting for the regulators.
Prevention of Attacks through Proactive Monitoring: A DevOps team proactively monitors threats so that the right action can be taken at the right time to rectify a security issue before it becomes a critical problem. Thus, threat mitigation solutions such as SIEM systems could monitor infrastructure incessantly and notify of suspicious activities.
Implementation of threat mitigation strategies ensures that not only is the code protected from vulnerabilities but also ensures that the organization is in compliance by identifying and pre-emptively solving security issues.
Implement Role-Based Access Control (RBAC): Security and Compliance frameworks often necessitate robust access controls. RBAC ensures employees and systems only get what is needed to perform those roles. This limits the attack surface but also keeps an organization in compliance with relevant regulatory exposures to sensitive data.
Auditing such access control policies ensures compliance with data privacy laws such as GDPR or HIPAA
Secure Cloud Environments Considering Compliance: When cloud-native applications become increasingly adopted, what would be the primary concern when it comes to keeping the cloud secure? In most cases, organizations rely on public cloud services for their processes related to DevOps, but these need to adhere to the relevant compliance standards, such as ISO 27001 or SOC 2.
A multi-layered approach to cloud security- considering encryption, identity management, and ongoing audit-be sure that not only the cloud infrastructure but also the application is actually compliant.
Compliance-First Culture: A compliance-first culture ensures DevOps security and compliance becomes part of the organizational mindset, Training and collaboration between the DevOps, security, and compliance teams will naturally ensure cooperation over compliance responsibility from the outset.
When people understand how compliance contributes to long-term business success, they are likely to follow best practices to ensure security along with adherence to regulatory standards.
Conclusion
As such, compliance in the DevOps world is closely linked to robust security as well as industry regulations. Striving for DevOps security and compliance through automation, monitoring, and a culture of accountability reduces risks and ensures regulatory alignment
At Codelynks, we ensure the DevOps practice of our clients aligns both with security and compliance requirements. With our cyber security expertise, we enable organizations to outperform future threats while simultaneously achieving success in regulatory compliance. Adopting automation, DevSecOps, and a compliance-first mindset ensures long-term DevOps security and compliance for your organization.