
Table of Contents
Introduction : Manufacturing ML Visual Inspection Edge Deployment India
A 2026 systematic review of industrial MLOps architectures, published in the International Journal of Computer Integrated Manufacturing, confirmed what anyone who has deployed production machine learning on a factory floor already knows: fully automated MLOps in manufacturing remains underdeveloped. Modular, scalable architectures with human-in-the-loop retraining are the production reality. Lab-validated models that go live without one degrade fast.
We work with a Tier-1 electrical goods manufacturer in Kerala running three production lines for wiring devices and switches. Their quality team had run a six-month pilot on surface defect detection using a convolutional neural network deployed on an NVIDIA Jetson Orin. Pilot results: 96% precision on surface scratches and 94% recall on dimensional non-conformance, compared to manual inspection accuracy averaging 78%. A genuinely strong result.
At the go-live review three months into production deployment, the precision had dropped to 71% on the same defect classes. Line supervisors had quietly reverted to manual inspection for one product family. The data science team was investigating the model. The model was not the problem.
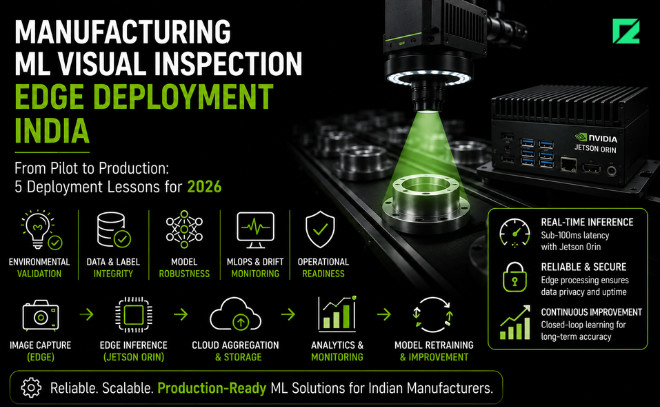
This post covers what causes deployed ML models to drift on shop floors, the five engineering dimensions that separate a pilot from a production deployment, and the framework we use to assess readiness before any manufacturing client goes live with edge ML.
The Deployment Gap No Pilot Captures
Pilot ML evaluations are run on curated datasets, in controlled conditions, with lighting that the camera team set up specifically for the model validation exercise. Production shop floors are none of those things.
Four environmental factors cause post-deployment drift in manufacturing ML that pilots do not capture:
Shift lighting variation. Overhead lighting on most Indian factory floors shifts in color temperature and intensity between day shift, second shift, and night shift sometimes dramatically. A model trained on images from the day shift has seen a systematically different color distribution than what it encounters at 11pm. The visual signature of a surface scratch under fluorescent 4000K light and under sodium-vapor 2100K light is measurably different for a convolutional model, even if it looks the same to a human inspector.
Tooling wear and surface texture drift. As stamping and injection-mould tooling wears over weeks and months, the surface finish on parts changes gradually. The model’s training set captured the surface finish at a single point in the tooling lifecycle. When tooling has worn 15% beyond the training-set baseline, the defect-to-surface contrast ratio the model was trained to detect has shifted enough to increase false negatives.
New SKU introduction. A model trained on product family A does not generalize to product family B without retraining. Manufacturing teams routinely introduce new SKUs within a product line without informing the data science team. The model encounters images from an untrained class and either rejects everything or nothing.
Vibration and focus drift. Camera mounting on production lines is rarely as mechanically stable as the pilot camera rig. Vibration from adjacent equipment, temperature-induced expansion in mounting hardware, and periodic accidental displacement introduce focal variation that degrades model input quality over time.
“The shop floor does not care about your validation set. It cares about the lighting change when the second shift turns on.”
Edge vs. Cloud Inference: The Decision That Defines Everything
NVIDIA Jetson Orin has become the de facto standard for Indian manufacturing ML deployments in 2026. The reason is straightforward: production line inspection requires sub-100ms inference latency, and most Indian factory floors have network connectivity that makes cloud inference unreliable for real-time decisions.
The specific numbers from our Kerala client: their assembly line runs at 120 parts per minute. Each part requires a 6-side inspection image sequence. Cloud inference round-trip latency averaged 340ms on their factory network unacceptable for a line that expects a pass/fail decision before the part reaches the next station 500ms later. Edge inference on Jetson Orin at INT8 precision runs the same inference in 18ms.
The trade-off is model management. Edge inference means the model lives on hardware distributed across the factory floor. Every model update requires deploying firmware to multiple edge devices, coordinating downtime, and validating the updated model in production conditions before relaunching the line. This is manageable with the right MLOps pipeline. It is operationally painful without one.
The counterintuitive architecture finding: the right answer for most Indian manufacturers is not edge-only or cloud-only. It is edge inference for real-time pass/fail decisions during production, with cloud aggregation of inference results, confidence scores, and flagged images for batch retraining. The Jetson Orin handles the production line. The cloud handles the learning loop.
“Buying an NVIDIA Jetson Orin is not an AI strategy. Edge hardware without a model retraining pipeline is just an expensive camera.”
The Shop Floor ML Deployment Readiness Matrix (SFMDRM)
Five dimensions, each assessed before production go-live. A red on any dimension means the deployment should not proceed.
Dimension 1: Environmental Validation. The production environment matches the training environment across five variables: lighting (color temperature and intensity at all shifts); camera position and focus stability; part presentation consistency (orientation and conveyor speed variance); background material and color; and ambient vibration level. Minimum requirement: training images captured across all three shifts, all relevant product families, and with tooling at both new and end-of-life wear states.
Dimension 2: Edge Hardware Configuration. NVIDIA Jetson Orin configured for the required inference precision (INT8 for speed, FP16 for balance, FP32 for accuracy validation). Power delivery and thermal management confirmed for the production environment temperature range. Watchdog process configured to restart the inference service on crash. Network connectivity to the cloud aggregation endpoint was tested under realistic factory network conditions.
Dimension 3: Model Versioning and Rollback. Every model deployed to production has a version tag, a training dataset hash, and a performance benchmark record. A rollback procedure exists: when Dimension 5 monitoring triggers a retraining alert, production can revert to the previous model version within 30 minutes. Model update deployments have a validation gate the updated model must pass a 200-image holdout set before replacing the production model on the line.
Dimension 4 : Human-in-the-Loop Integration. The system does not make autonomous accept/reject decisions on borderline cases. Define a confidence threshold below which the system flags for human review rather than issuing a decision. The review queue must be accessible to the line supervisor in real time, with a response time expectation defined and enforced. Reject the architecture that removes the human from borderline decisions entirely.
Dimension 5 : Drift Monitoring and Retraining Triggers.Three production metrics monitored weekly: precision and recall on a sampled holdout of production images (requires periodic manual re-labelling of a small production sample by QC staff); false positive rate, which drives production line downtime when the model rejects conforming parts; and confidence score distribution, which shifts measurably before precision and recall metrics visibly degrade. Define retraining triggers: when precision drops 5 percentage points from the baseline, or false positive rate exceeds 8%, trigger a retraining cycle.
What “Monitoring” Actually Means on the Factory Floor
The standard MLOps monitoring approach: log predictions and alert on metric drift does not translate directly to manufacturing without one critical addition: you need periodic manual re-labeling of production images to maintain a ground-truth reference.
Your model runs on images that have never been labelled by a human. It is making predictions. You do not know if those predictions are correct unless someone periodically labels a sample. For a production deployment generating 50,000 images daily, a 200-image weekly sample labeled by a QC engineer takes approximately 45 minutes. That 45-minute investment is the difference between detecting drift before it becomes visible in scrap rates and finding out about it from the line manager.
Our recommendation: dedicate 2 hours per week of QC engineer time to production image labelling and model performance validation. Cost: trivial. Value: the early warning system that prevents a 96% pilot model from silently becoming a 71% production system.
“A model that scored 98% in the lab and 71% at month two did not fail. You deployed it into an environment it was never trained on.”
What This Means for Manufacturing Leaders
The AI visual inspection market in India is real and growing. NVIDIA Jetson Orin deployments are live in automotive, electronics, textiles, and packaged goods facilities across the country. The technology is production-proven. The gap is not the model. The gap is the deployment architecture and the operational discipline to maintain it.
The Industry 5.0 human-AI collaboration model is not a regression from full automation. It is the honest architecture for complex manufacturing environments where lighting, tooling, and SKUs change continuously. A human-AI system that maintains 92% precision at 18 months is more valuable than an autonomous system that peaked at 96% and was quietly abandoned after the third drift incident.
Three things you can do this week without engaging Codelynks:
First, run a lighting audit across all three shifts on your production lines. Photograph the same part under all shift lighting conditions and compare the images. If the color temperature variation is visually apparent to a human, it is a training data problem you need to address before any ML deployment.
Second, check your production camera mounting. Apply a reference fixture to the conveyor, start the line, and photograph it 100 times over 30 minutes. Measure position variation in the image frame. More than 5 pixel variation in the reference fixture position indicates a mechanical stability problem.
Third, if you have an active ML deployment, pull the model confidence score distribution from the last 30 days and plot it. A distribution shifting toward lower confidence scores, with more predictions clustering near the 0.5 boundary is an early drift signal that typically precedes visible precision decline by 3 to 4 weeks.
More Blogs : AI Engineering Services for Enterprises: What They Include and Why They Matter