How to Build a DevSecOps Pipeline With Autonomous Security Enforcement

DevSecOps pipeline architecture with autonomous security enforcement

A security scan that runs after your build is not a DevSecOps pipeline. It is a security checkbox that runs after your build. The distinction matters because one approach catches vulnerabilities before they reach production, and the other hopes someone reads the report.

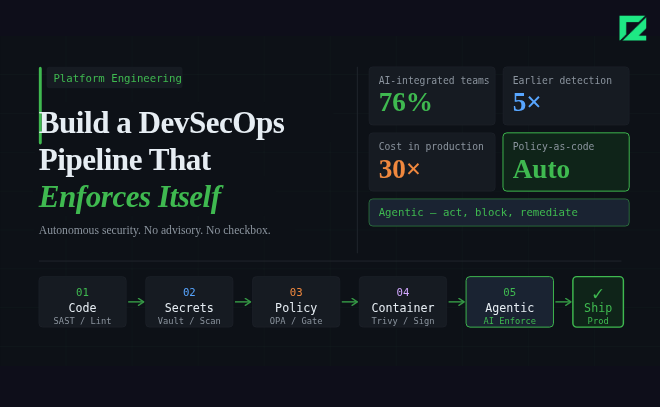
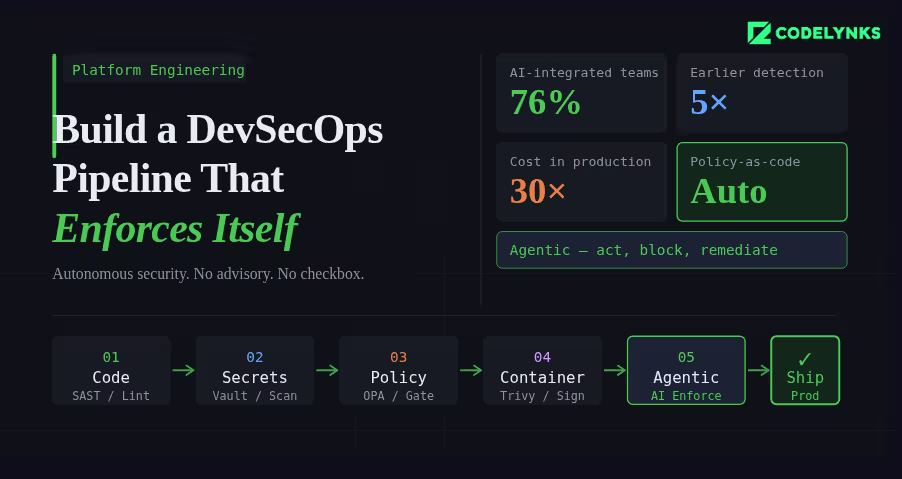
According to industry data from N-iX and DZone’s 2026 DevOps surveys, 76% of DevOps teams have already integrated AI into their CI/CD pipelines. The shift happening now is not just more tooling in the pipeline. It is tooling that can act, enforce, and remediate, not just report. This guide explains how to build a pipeline where security is a hard constraint, not an advisory. A modern DevSecOps pipeline integrates automated security checks into every CI/CD stage.

The Architecture of a Secure Pipeline

A DevSecOps pipeline has security controls at four stages: before the commit, during the build, before deployment, and in production. Each stage catches different classes of vulnerability. Skipping any stage creates a gap that will eventually be exploited.

Stage 1: Pre-Commit Hooks

Pre-commit hooks are the first line of defense. They run on the developer’s machine before code reaches the repository.

What to run at pre-commit:

  • Secrets scanning: Detect API keys, credentials, and tokens before they are committed. Tools: detect-secrets (Yelp), gitleaks, or truffleHog. Configure with a deny-list that matches your organisation’s credential patterns.
  • Linting and formatting: Enforce code style standards. Not strictly security, but a consistent codebase is easier to audit.
  • Infrastructure-as-code validation: If developers write Terraform or Kubernetes manifests, run a lightweight policy check (tflint, kubeval) to catch obvious misconfigurations before the commit reaches the pipeline.

Use the pre-commit framework (pre-commit.com) to manage hooks declaratively in a .pre-commit-config.yaml file, committed to the repository. This ensures every developer runs the same set of checks.

Stage 2: Build-Time Checks (Pull Request Gate)

Every pull request should trigger a suite of automated security checks that must pass before the branch can be merged. These are the pipeline gates.

  • Static Application Security Testing (SAST): Analyse source code for known vulnerability patterns without running the code. Tools: Semgrep (best open-source option), Checkmarx (enterprise), SonarQube with security rules. Configure severity thresholds: CRITICAL and HIGH findings block the merge, MEDIUM and LOW generate tickets.
  • Software Composition Analysis (SCA): Check every open-source dependency against known CVE databases. Tools: Snyk, OWASP Dependency-Check, GitHub Dependabot. Flag dependencies with CVE scores above your threshold. The biggest advantage of a DevSecOps pipeline is continuous security enforcement during development and deployment.
  • Infrastructure policy validation: Run Checkov or Terrascan against all Terraform and CloudFormation changes in the PR. Policy violations block the merge.
  • SBOM generation: Generate a Software Bill of Materials for the build artifact. Tools: Syft, CycloneDX. Store it as a build artifact. This is becoming a procurement requirement for enterprise and government customers.

Stage 3: Pre-Deployment Checks

Before any artifact reaches staging or production, validate the complete deployable unit, not just the source code.

  • Container image scanning: Scan the built container image, not just the application code. Base images carry their own vulnerabilities. Tools: Trivy (open source, fast), AWS ECR scanning, Google Artifact Analysis. Block deployment of images with HIGH or CRITICAL CVEs in base image packages.
  • Image signing and verification: Sign built images with cosign (Sigstore) and enforce signature verification at deployment time using a Kubernetes admission controller. This prevents tampering between build and deployment.
  • Kubernetes manifest validation: Validate deployment manifests against your security policies using Kyverno or OPA/Gatekeeper as an admission controller. Block pods running as root, containers without resource limits, and images from unauthorised registries.

Stage 4: Runtime Security Monitoring

Deployment is not the end of the security pipeline. Production has a different threat surface than the build environment.

  • Runtime threat detection: Tools like Falco (open source) or Sysdig detect anomalous behaviour in running containers: unexpected outbound connections, process executions that are not in the image, file system writes to unexpected locations. Alert on these immediately.
  • Periodic image rescanning: A CVE-free image today may be vulnerable tomorrow. Schedule weekly rescans of all images in your container registry. Automatically open tickets for newly discovered vulnerabilities in deployed images.
  • API anomaly detection: Unusual API call patterns, authentication failures above baseline, and privilege escalation attempts in production need automated detection and response. Define your baseline, set alerting thresholds, and create automated response playbooks for the highest-severity patterns.

Where Agentic AI Fits In

The 2026 evolution in DevSecOps is not just more tools. It is tools that can reason about context, suggest remediations, and act autonomously on low-risk findings.AI-powered monitoring is becoming a core capability in every enterprise DevSecOps pipeline.

AI-powered SAST tools can understand the data flow context of a vulnerability, not just its pattern signature. A SQL injection vulnerability in a function that only receives internally-validated input has a different risk profile than one receiving raw user input. Contextual analysis produces fewer false positives and more accurate severity ratings.

AI remediation suggestion at the pull request stage has demonstrated significantly higher fix rates than traditional vulnerability reporting. When a developer sees a suggested code change alongside the vulnerability finding, they fix it immediately. When they receive a ticket in Jira, it joins the queue.

Getting Started: The Minimum Viable DevSecOps Pipeline

If you are starting from zero, do not try to implement all four stages simultaneously. Build in this order:

  1. Add secrets scanning as a pre-commit hook and as a pipeline check. This is the highest-severity gap in most pipelines and takes less than a day to implement.
  2. Add SCA for dependency vulnerability scanning on every PR. Use Snyk or Dependabot. Configure automated PRs for patch-level updates.
  3. Add SAST with Semgrep. Start with the community rulesets, tune the false positive rate for your codebase over the first month.
  4. Add container image scanning with Trivy. Block deployment on CRITICAL CVEs, alert on HIGH.
  5. Add infrastructure policy checks with Checkov. Define your top-10 must-enforce policies first.
  6. Add runtime monitoring with Falco. Define alert rules for your most sensitive workloads first.

Steps 1-4 can be implemented within two weeks. Steps 5-6 require more planning but are achievable within a quarter.

Need Help With This?

Codelynks builds DevSecOps pipelines for engineering teams in regulated industries. If you need a security posture assessment or want to design a CI/CD pipeline with autonomous security enforcement, talk to our team at contact us

6 Essential Secrets Management in Platform Engineering to Secure Multi-Cloud Infrastructures

secrets management in platform engineering

Introduction

Secrets management in platform engineering: Platform engineers, though far from sight, are the backbone to a world of moving pieces – in the fast-changing landscape of cloud infrastructures, where an ever-changing setup continually creates needs for secure, scalable, and efficient cloud environments. One critical aspect of what they do includes managing secrets: securely managing sensitive information like passwords, API keys, or encryption keys. Because more and more organizations move their architectures into multi-cloud, robust secrets management tools have never been as critically necessary as now.

This blog discusses how engineers building platforms use secrets management in safeguarding cloud-based infrastructures and in adding speed to more agile development workflows.

Role of Secrets Management in Platform Engineering

Secrets management becomes a critical factor for platform engineers, who are responsible for the cloud infrastructure, without undermining the security posture but enabling teams to move fast. Problems arise when needing to balance the importance of giving developers access with the requirement for tight security.

Effective secrets management in platform engineering ensures developers can work safely without compromising cloud security.By implementing secrets management in platform engineering, organizations can secure multi-cloud infrastructures while enabling faster DevOps workflows.Secrets management is something an organization needs irrespective of where it stands in terms of cloud services. In the world of cloud-native infrastructure, this will likely be least based on dynamic credentials, API tokens, and keys that give a license to use any given service, database, or application. If such credentials aren’t managed properly, they can easily breach the security wall and cause data leaks or unauthorized access to critical systems.

Challenges in Multi-Cloud Secrets Management

As companies increasingly use multi-cloud strategies, it has become more complicated for managing secrets across cloud environments. Every cloud provider has their identity management protocols that create a disjointed approach to dealing with secrets.

Some of the common challenges are as follows:

Decentralized Secrets Storage: Secrets storage is distributed across multiple clouds, platforms, and tools, causing trouble in maintaining a centralized, consistent approach toward secrets management.

Dynamically Secrets: Modern cloud platforms rely heavily on dynamically secrets, which expire within a time window. Secrets must be automatically rotated without disrupting services.

Access Control: The right developers shall have access to the appropriate secrets and must not be granted privileges that supersede the requirement.

Secrets Management Tools Pulumi, HashiCorp Vault, and Beyond

Several solutions have emerged to make the job of handling secrets across multiple cloud environments easier for platform engineers. Two of the key solutions are Pulumi’s Environments, Secrets, and Configurations (ESC) and HashiCorp Vault.

Pulumi ESC: The Pulumi ESC provides platform engineers with a centralized tool for managing secrets and configurations across multiple environments in the cloud. It supports all popular programming languages, including Python, Go, and TypeScript, so engineers can code control for both secrets as well as environment configurations.

Key features of Pulumi ESC include:

Centralized Management: Simplifies management across the different environments and clouds.

Version Control: Tracks the change history for secrets and configurations, providing full traceability.

Integration with DevOps Tools: Supports automation workflows and integrates with CI/CD pipelines for seamless secrets rotation and updates.

HashiCorp Vault: The most commonly used secrets management tool is HashiCorp Vault.

Robust security features on:

Secret generation on demand: Vault can dynamically generate secrets on demand. Credentials are always valid for a short time.

Only needed access to specific users: With policy-driven access control, Vault lets engineers exactly who needs to see which secrets.

Vault automatically will rotate those secrets, minimizing exposure.

Both HashiCorp Vault and Pulumi ESC are must-haves for platform engineers with infrastructures that include lots of clouds and complex infrastructures.

Best Practices for Multi-Cloud Secrets Management

For the effective and secure management of secrets, platform engineers shall follow the best practice of:

Centralized Secrets Storage: Through Pulumi ESC or HashiCorp Vault, engineers can centrally store all the secrets, thereby easily tracking and rotating credentials while auditing their activities. A centralized approach reduces mistakes and lost credentials in various cloud settings.

Automatic Secrets Rotation: Secrets rotation should be automated to avoid risk. Most secrets management tools support automated rotation. Credentials will be updated as often as required without disrupting any services. c. Least Privilege Access

Least privilege should also be applied in secrets management. Each user or service must be provided with the least access to ensure that the sensitive data may not be accessed by any unauthorized persons. d. Monitor and Audit Secrets Usage

The platform engineers are supposed to monitor secret usage and send an alert for patterns that look abnormal. Auditing logs can be used to identify potential risks and ensure that company security policies are in place.

Secrets Management and DevOps: Integrating Security in Workflows

As DevOps brings faster development cycles and continuous integration into focus, the management of secrets must now be integrated into CI/CD pipelines to avoid bottlenecks in such workflows. The automation of provisioning and access control of secrets in these workflows ensures that platform engineers can make sure security doesn’t become an anchor for development.

Secrets can be injected automatically into applications at deploy time using tools such as Pulumi ESC and HashiCorp Vault, thus avoiding the sensitive data exposure to developers or build systems.

The future of secrets management in platform engineering

With cloud infrastructures getting increasingly complex, secrets management would play an even more important role. Future innovations in that space will probably revolve around

AI-driven automation would predict and prevent probable security breaches and mishandling of secrets.

Stronger Integration with DevSecOps- Secrets management tools would eventually have more roles in the full lifecycle of DevSecOps, by tightly controlling and auditing secrets across the cycle of development and operations.

Conclusion

Secrets management becomes a crucial component of platform engineering, providing an appropriate level of security for cloud infrastructure while speeding up development cycles. By centrally storing secrets, automating their rotation, and integrating secret management within DevOps workflows, the platform engineers thus protect their environment and enable developers to work more efficiently.

By implementing secrets management in platform engineering, organizations can secure multi-cloud infrastructures while enabling faster DevOps workflows.

More Blogs: Serverless Computing: Top 5 Scenarios and Effective Implementation Tips

Mastering DevOps Monitoring and Logging: Proven Strategies for 2024

Illustration showing DevOps monitoring and logging processes with tools and strategies for 2024

Introduction

DevOps monitoring and logging have been such cornerstones in the modern environment of rapid, shifting DevOps that is present today. This is because, at the end of the day, these practices are crucial to ensuring effective reliability, optimal performance, and fluid deployment throughout the software development lifecycle. I have more than 12 years of experience as a DevOps specialist and have a first-hand feel for how effective monitoring and logging really inspire operational excellence. This post will analyze their roles in DevOps and the best practices for their implementation.

Why DevOps Monitoring and Logging is Important

DevOps mainly focuses on agility, collaboration, and continuous improvement. For this, a team needs real time-visibility into their systems and applications. DevOps monitoring and logging have been such cornerstones in the modern environment of rapid, shifting DevOps that is present today. Both are meant to support organizations to detect a problem in an early stage, enhance performances, and ensure that all systems are working out.

Monitoring is just tracking system performance in real-time, with metrics such as CPU usage, memory consumption, and response times. Monitoring tools alert teams to problems, and then that team can move fast to react.

Logging is essentially the recording of any and all system events and activities. Logs capture detailed information about transactions, errors, and user activity, and thus are invaluable for troubleshooting and audits.

Monitoring and logging go hand in hand and can give a whole view of the system so that DevOps teams can keep maintaining availability and quick response times to issues.

Best Practices for DevOps Monitoring and Logging

Early Detection of an Issue and Faster Incident Response: In the DevOps world, effective DevOps monitoring and logging help minimize costly downtime. Tools like Prometheus, Nagios, or Datadog help teams to discover anomalies before they balloon out of control into critical service incidents. For instance, if, out of nowhere, your server’s CPU usage shoots up, monitoring systems can alert your team so that it can address the issue before the service goes down.

It will accelerate the diagnosis and root cause with correlated monitoring data and logs. For instance, an alert that can be attributed to a slow response time may be correlated with database error logs. The engineers can find and correct the problem on the spot.

Better Security and Compliance: DevOps monitoring and logging play a critical role in safety and compliance, ensuring visibility into every event and anomaly. Solutions like Splunk and ELK Stack (Elasticsearch, Logstash, Kibana) track attempts to access a system in a shady manner or who are penetrating data breaches or other suspicious activity. Logging is required for auditing those activities that may comply with different regulations, such as GDPR or HIPAA.

For example, in terms of a security attack, proper logging would trace what happened back from the given incident, identify which vulnerability was exploited, and work to take corrective action so that such an incident will not occur again. Without proper logging, it’s hard to determine what went wrong and how it can be prevented in the future.

Continuous Improvement with Data-Driven Insights: DevOps monitoring and logging help teams track performance trends over time and identify areas for optimization. System metrics in all of these matters are kept under constant monitoring, thereby allowing teams to fine-tune their applications for increased efficiency.

Monitoring often shows specific processes that consume too much memory and so the cause of the occurrence is investigated, which enhances optimizations that improve performance.

Good Practices for Monitoring and Logging in DevOps

To get the maximum benefit from DevOps monitoring and logging, best practices should be followed which suit your infrastructure and operational needs:

Establish a Proactive Monitoring Approach : Monitoring should not only be a reactive but also proactive form of work in an effective DevOps team. Alerts are so commonly configured with metrics for CPU usage, memory consumption, disk I/O, and response times, among others. For sure, the thresholds should reflect the operational limits, without causing unnecessary false alarms but still timely.

Implement tools such as Grafana that would allow you to build custom dashboards for KPI across applications and infrastructure. These are dashboards that may even give you a centralized view of your systems’ health to track possible issues long before they can become apparent.

Log Aggregation and Centralization: Log data can become very scattered if logged across many different services and environments. Use tools like Graylog or Fluentd for aggregating logs from heterogeneous sources. That way, log aggregation will be centralized, as this will really help in the search and filtering process, and it will save a lot of time during the incident response process.

In addition to this, logs must be structured and uniform. This would make it quite simple for the system to parse it programmatically and determine relations across different components of your system.

Automating Response to Alerts: One of the key ways to make the process more effective in DevOps is automation. Actually, this point about automatically being able to respond to monitoring alerts is a great example of how you can reduce downtime and recover faster. For example, if the CPU on a server has reached a certain threshold, your monitoring tool can automatically trigger scaling scripts which will then spin up servers necessary to propagate the load.

The automation cuts down the scope of manual intervention and allows more strategic work for the team.

Enable Log Rotation and Retention Policies: The longer that logs become, the more they could pose problems with storage management. Note that you enable log rotation policies wherein you archive or delete old logs automatically so you would not allow a surplus of log data to take up all your disk space. Implement retention policies consistent with your business operational needs as well as compliance requirements.

For example, the production logs might have to be maintained for six months due to legal reasons, while the development logs would only need to be stored or deleted for a shorter time period.

Leverage AI and ML for Predictive Analytics: Many of the advanced DevOps monitoring and logging systems today include AI and machine learning for predictive analytics. Tools such as New Relic and Dynatrace can analyze historical data to understand patterns and predict when system resources may get exhausted. The generated predictions inform teams to take preventive action to avoid outages as much as possible.

Conclusion

This is the land of DevOps, where speed, reliability, and efficiency are everything. DevOps monitoring and logging are the foundational elements of modern operational excellence. Indeed, they deliver that visibility to quickly identify and resolve issues, enhance security, and optimize performance. Proactive monitoring, centralized logging, and automated responses by the teams of DevOps will ensure that the applications run smoothly, offering value to the users every time. These are the best practices you need to implement to get your DevOps pipeline on the right path to long-term success and stability.

More blogs: 7 Essential Steps for Migrating to Microservices: Ensure a Smooth DevOps Transition

Serverless Computing: Top 5 Scenarios and Effective Implementation Tips

Serverless Computing architecture showing event-driven functions, microservices, and real-time data processing in the cloud

Introduction

Serverless computing is one of those transformative technologies in the ever-changing world of cloud computing. It has allowed developers to rethink and redesign ways to build, run, and deploy applications without traditional server management. With the help of serverless architectures, infrastructure concerns can be abstracted; hence, developers can focus completely on writing code while the scaling, maintenance, and provisioning are taken care of by the cloud providers. So, when is serverless the right solution, and how do you implement it well?

Here, we will go through five fundamental use cases of serverless computing and provide the reader with useful advice on its implementation for maximum efficiency and scalability.

Event-Driven Applications

The most common event-driven application that serverless computing is applied to is in build scenarios. The characteristic of such applications is that they react towards specific events, including updates in a database, uploads of files, or HTTP requests. Of particular advantage in such an environment are serverless platforms like AWS Lambda, Azure Functions, and Google Cloud Functions, which can run small units of code and run in response to predefined triggers.

For example, an e-commerce website may leverage serverless functions to automatically process payments or update the stock of inventory based on a customer’s order. These functions only run when invoked, so serverless computing is a cost-effective play, paying as much only for the actual compute time consumed.

Implementation Best Practices:

  1. Make your functions small, specific, and fast.
  2. Use event-driven architectures where different services can invoke serverless functions based on real-time events, such as S3 file uploads or database changes.
  3. Leverage managed services such as AWS EventBridge or Azure Event Grid to integrate serverless functions into your larger cloud-ecosystem.

Microservices Architecture

Serverless computing is well-suited to microservices architectures, which divide an application into small, independent services that communicate with each other using APIs. You can improve scalability and maintainability while cutting the complexity of managing individual instances of the server by running each microservice as a separate function or set of functions.

For instance, an e-commerce application will employ microservices in order to go as far as authentication of users, inventory management, the processing of a payment gateway, and order fulfillment, all acting independently as different serverless functions. This makes it even easier to scale the services appropriately.

Implementation Best Practices:

  1. Divide large monolithic applications into smaller, more focused microservices that can be developed and released independently.
  2. Use an API gateway like AWS API Gateway or Azure API Management to handle communication between serverless microservices and other services.
  3. Ensure that all your microservices are stateless to fully benefit from scalability through serverless.

Real-Time Data Processing

One of the strong use cases for serverless computing is real-time processing of data. It can be applied in applications requiring streams of processing, such as IoT devices, financial transactions, or social media feeds to process and respond to events happening with data in real-time.

For example, IoT applications that gather data from thousands or hundreds of sensors use serverless functions to process incoming streams of data and initiate alerts, with the processed information being sent to the respective databases. Serverless computing does not require provisioning and managing servers to handle the large volume of incoming data since the functions scale up depending on the demand created.

Implementation Best Practices:

  1. To handle high-volume input data streams, one can rely on services such as AWS Kinesis, Google Cloud Pub/Sub, or Azure Event Hubs, all managed by Amazon, Google, and Microsoft respectively.
  2. Use serverless functions to handle transformations and processing of real-time data streams where certain metrics are hitting the threshold or triggering workflows.
  3. Implement monitoring and logging solutions like AWS CloudWatch or Azure Monitor to keep track of data processing performance or if there is any bottleneck.

Scheduled Tasks and Automation

Serverless computing fits well with automated scheduled tasks that do occur periodically or at set times for execution. It applies very well to the regular sending of a daily report, running regular backups, or processing maintenance scripts.

For example, it might be a case where a team of marketers would send weekly email campaigns through an automated serverless function. A time-based event triggers the serverless function to execute a task at the exact scheduled time and does not require any manual intervention in doing so or incur any overhead of infrastructures.

Implementation Best Practices:

  1. Use cloud-native schedulers like AWS CloudWatch Events or Azure Logic Apps to schedule executions of serverless functions at specific intervals.
  2. Ensure scheduled tasks handling functions do not cause failures by being stateless such that they can be run independently so they will not fail or delay.
  3. Reduce operation overhead through serverless functions, used for infrastructure maintenance, like database backups or data cleaning processes.

Cost-Effective, Scalable Web Apps

Scaling up and cost-effectiveness in the development of web applications are usually a priority for startups and small businesses. Serverless computing enables companies to deploy web applications without worrying about the need to provision servers, short-lived traffic spikes, or scaling infrastructure.

Business can use services such as AWS Lambda or Azure Functions to develop websites and APIs that only consume resources when there is user traffic. It is therefore ideal for applications that have variable or unpredictable workloads because the serverless functions automatically scale up when there is growing traffic to ensure high availability without pre-provisioned infrastructure.

Implementation Best Practices:

  1. Divide large monolithic applications into smaller, more focused microservices that can be developed and released independently.
  2. Use an API gateway like AWS API Gateway or Azure API Management to handle communication between serverless microservices and other services.
  3. Ensure that all your microservices are stateless to fully benefit from scalability through serverless.

How to Implement Serverless Computing

Serverless computing is quite effective if one would implement serverless in his environment once there are identified the right usage cases for serverless computing.

Here are some tips for getting going on serverless computing as well as maximizing its benefits.

Select the Platform: Major cloud providers provide serverless platforms, among which AWS, Azure, and Google Cloud are more comprehensive. Select one suitable for your already existing cloud infrastructure and business requirements.

Cold Starts Optimization: Latency incurred by serverless functions can sometimes be caused by the cold start, where the environment takes about a few seconds to spin up. Reducing the impact of latency should begin with having light code, being conservative about dependencies, and using provisioned concurrency for your most critical applications.

Cost Management: Because serverless computing is inherently inexpensive, it’s important to be on top of the usage patterns that can create runaway costs from excessive invocations or long-running functions. Use cloud cost monitoring tools to watch out for spending and optimize function execution.

Microservices Mindset: Since serverless functions are best suited for stateless operations, embrace the microservices architecture where every function performs a specific task and scales easily with minimal faults isolated from each other.

Infrastructure as Code (IaC): Deploy serverless platforms using IaC tools, such as AWS CloudFormation, Terraform, or the Serverless Framework. With IaC, manage serverless deployments to automate the deployment process and version control configurations for consistency across environments.

Conclusion

Serverless computing ended the myth of having to manage infrastructure directly while building, deploying, and scaling applications. From event-driven workloads to costing out optimizations for web applications, the use cases for serverless are both diverse and extremely valuable for modern DevOps and cloud teams.

Knowing when to use serverless computing and doing it well will allow organizations to focus more on delivering value and innovation rather than the overhead of managing the servers. Serverless computing offers organizations to build microservices, process real-time data, and run scheduled automations in a powerful, scalable, and cost-effective manner, making it an integral component for modern cloud environments.

More Blogs : The Amazing Ultimate 2025 Guide to AI in eCommerce Trends and Predictions

Kubernetes Optimization: Top 7 Ways to Boost Resource Utilization

kubernetes-optimization-tips-2025

Introduction

Kubernetes continues to be the leading container orchestration application, and its optimization has been critical for development teams looking to realize fully high performance with efficient usage of resources. Resource management, scaling workloads, and minimization of operational cost become key issues in achieving high-performing Kubernetes clusters.

Below are seven tips on improving Kubernetes optimization so that your clusters run efficiently and effectively.

Tips on improving Kubernetes optimization

Optimizing Kubernetes Resource Requests and limits: Among other things, how well you define your resource requests and limits for each pod turns out to be a main factor affecting Kubernetes optimization. Kubernetes lets you define the minimum amount of CPU and memory that a container can use (requests)and maximum amount that a container can use (limits). You really need to find that balance when you are defining those limits and requests.

In case the resource requests are too high, the applications tend to over-consume your resources, starving other applications of resources. If the resource requests are too low, you may cause underutilization of hardware or even force the pod into throttling under load, degrading performance.

Best Practices

  1. Monitor and measure the actual resource usage of your applications by using tools like Prometheus and Grafana.
  2. Use a VPA to automatically scale back requests based on historical usage patterns.
  3. Tune your requests and limits periodically as your application grows or gets scaled up.

Kubernetes Horizontal Pod Autoscaling: The greatest factor leading to better Kubernetes performance is the Horizontal Pod Autoscaling (HPA). HPA automatically scales the number of replicas of a pod in a deployment based on CPU or memory usage. As such, dynamically scaling your pods allows Kubernetes to ensure that an increased load does not cause your application to break down due to overprovisioning on resources.

However, better ways to set your scaling metrics and thresholds can optimize HPA.

Best Practices

  1. Use custom metrics besides the default CPU and memory metrics to align HPA better with your application’s performance
  2. Test your HPA configurations in various environments, ensuring good scaling behavior under load
  3. Review your HPA thresholds and metrics regularly, as traffic patterns and workloads are likely to evolve over time

Optimize Kubernetes Node Resource Utilization with Cluster Autoscaler: The Kubernetes Cluster Autoscaler plays a major role in optimizing the utilization of resources based at the node level. Cluster Autoscaler adds or removes nodes from a Kubernetes cluster based on resource usage so that your cluster will have enough resources to meet the current demands without wasting infrastructure costs.

Setting up Kubernetes optimization correctly ensures proper cluster autoscaling, avoiding over-scaling and under-scaling, which would result in inefficient use of resources or poor performance.

Best Practices

  1. Set appropriate node group size and distribute workloads across node pools for the best possible utilization of resources.
  2. Automatically remove nodes when not in use to avoid costs that are not really necessary.
  3. Make use of the spot instances or whatever low-cost instances are available for non-critical applications.

Define Quotas and Limits for Namespaces: Another Kubernetes optimization strategy is defining quotas and limits for Kubernetes resources in namespaces. Quotas allow for the boundaries of what will be used with regard to total CPU or memory, together with other resources at large within a namespace. This ensures the prevention of resource starvation and fair distribution of resources among applications.

With proper configuration of quotas and limits, a resource may not be hogged by a certain application in a cluster, hence improving overall performance and resource usage.

Best Practices

  1. Resource quotas should be defined based on the needs and priority of the applications.
  2. Namespaces should be monitored; quotas should be updated based on changes in the workloads of the applications.
  3. Combination of resource quotas with Kubernetes priority classes to ensure that vital applications get enough resources.

Levers Available Within Kubernetes for Monitoring and Logging: Keeping tabs on your clusters is a never-ending process in the art of Kubernetes optimization. Utilizing powerful monitoring and logging tools gives you a clear view of how resources are being utilized and where possible bottlenecks may be lurking.

The most commonly used Kubernetes monitoring tools often include Prometheus, Grafana, and Elasticsearch. These help track resource usage, monitor pod performance, and reveal room for improvement in every cluster setup.

Best Practices

  1. Set up alerts for the high utilization of all types of resources like CPU, memory, and disk I/O.
  2. Provide logging solutions including Fluentd or Logstash in order to gather and analyze logs spread across your cluster.
  3. Monitor those performance metrics and log for improvements needed in resource optimization over time.

Scalable Kubernetes Networking with CNI Plugins: Network performance and large clusters form a very important part of Kubernetes optimization. CNI, or Container Network Interface, is what manages networking in Kubernetes. The role and performance are different, and various types of CNI plugins are available in the market- Calico, Flannel, and Weave to name a few.

As a best practice, optimizing your networking stack has a great importance as far as enhancement of the pod-to-pod communication, the reduction in latency issues, and overall Kubernetes performance is concerned.

Best Practices

  1. Select an appropriate CNI plugin for your application’s networking requirements, depending on one or more aspects like security, performance, and scalability.
  2. Continuously observe your network traffic and bandwidth usage to identify probable bottlenecks.
  3. Leverage service mesh technologies like Istio for better routing, load balancing, and network security.

Kubernetes Cost Optimization By Resource Efficiency: Besides performance, there is another crucial area of the optimization of Kubernetes cost management. Poorly configured clusters can lead to over-provisioned resources and increased cloud costs. Optimizing for resource efficiency directly means reducing operation costs without affecting the performance of operations.

Best Practices

  1. Implement FinOps as a strategy for monitoring and controlling the expenditure of cloud across Kubernetes clusters.
  2. Right-size the pods and nodes to avoid over-provisioning resources.
  3. Through Kubecost or CloudHealth tools, you can gain Kubernetes cost visibility and resource utilization.

Conclusion

With the changes happening in the world today, the implementation of Kubernetes ensures optimization, thereby keeping it at its highest performance levels, minimizing cost when it comes to operations, and saving on optimum resource utilization. Optimization of Kubernetes in any means-from tuning their resource requests and limits to policy-based automation of advanced auto scaling strategies-actually works best.

By following these seven tips, you are headed towards improving the performance of your Kubernetes cluster and the utilization of resources. Whether you are managing an extremely small cluster or large-scale deployments, when you take time to fine-tune your setting, you’ll ultimately enjoy higher productivity, reliability, and cost efficiency in the long run from scalability.

Keeping the curve ahead, it is important to periodically review one’s Kubernetes configuration and stay on top of the latest tools as well as best practices so that one’s clusters are continuously optimized with respect to the evolving needs of the business.

More Blogs: 7 Reasons Why DevSecOps is the Future of Secure Software Development

Securing Cloud Infrastructure: Key Best Practices to Mitigate Threats

Cloud security best practice: IAM workflow diagram

 Introduction

As businesses are driving their operations with cloud technologies more and more, securing cloud infrastructure is a primordial issue. All these powers of scalability, flexibility, and efficiency on cloud platforms do take a notch on the scale against security, as the challenges that cloud infrastructure creates are unique and specific. This writer has seen firsthand the importance it becomes in having the correct cloud security best practices provided to the infrastructure to protect it from emerging cyber threats, as he himself is an experienced Platform Engineer. In the next blog, you will learn top cloud security strategies in the security of your infrastructure and business operations.

IAM: A Core Cloud Security Best Practice

The nucleus of any robust security strategy begins with gaining control over your access into the cloud infrastructure. IAM is essential to ensure only authorized users and systems can gain access to critical cloud resources.

Best Practice: Apply the principle of least privilege-a personal data subject should have no greater access than necessary and no greater access period than necessary. The maintenance of permissions must be reviewed regularly for expired or unnecessary credentials to be revoked. Implement multi-factor authentication (MFA) to provide an additional layer of security, with it becoming much harder for a thief to gain unauthorized access.

Example: An entity that is using AWS would be able to use IAM roles to define who in the organization gets access to what cloud resources. With MFA and regular reviews of who has what permissions, this diminishes the threats both from insider threats as well as compromised accounts.

Data Encryption: Key Cloud Security Best Practice

Data security is the most critical need in a cloud environment, especially when dealing with sensitive information. A ciphertext is thus required to encrypt data as it is transmitted between cloud servers or stored within your infrastructure as an important defense mechanism against cyber attacks.

Best Practice: Data Encryption Ensure that the data is encrypted in both transit (in transferring via networks) and in rest (at the time of storing of data in cloud servers). It may be achieved by robust encryption protocols, for instance, AES-256 in the case of storing data and TLS/SSL in the case of transmission.

Example: A healthcare organization that stores patient records in the cloud allows encryption on both databases and during network transfers to comply with HIPAA and avoid unauthorized access to sensitive data.

Monitoring and Logging: Cloud Security Best Practice

Continuous activity monitoring and logging in the cloud are therefore necessary for real-time detection of security incidents and gaining visibility into your cloud environment. Monitoring also helps identify potential security threats and lessen security risks through quick response.

Best Practice: All cloud resources shall be equipped with real-time monitoring and logging. Use the likes of AWS CloudTrail, Azure Monitor, or Google Cloud’s Logging services for reviewing and analyzing activity in view of following significant and unusual activities such as unauthorized access attempts or unexpected changes in configuration.

Example: A finance company using AWS CloudTrail can clearly see each call to the API and track what changes are being made to the cloud-based infrastructure. They, therefore, can act swiftly if someone is attempting without permission to alter the security groups or access sensitive information.

Regular patching as well as updating of cloud systems

These cyber hackers often target known flaws in old software or the unpatched system to roll out attacks. Hence, updating cloud infrastructure with latest patches and security updates goes a long way in protecting such attacks.

Best Practice: Have an ongoing patch management process where every cloud-based system, application, and service gets patches regularly. When possible, have automatic updates and ensure critical patch updates that cover security vulnerabilities are addressed.

Example: A software company running applications on Google Cloud keeps patching its servers and virtual machines using Google’s OS Patch Management service. Through continuous updating of their systems, they can decrease the chances of attacks based on unpatched vulnerabilities.

DevSecOps Automation for Cloud Security Best Practices

One of the most significant means to improve efficiency and maintain a good security posture in modern cloud environments is through automation. When a culture integrates security into the development and deployment pipeline, it is possible to detect and resolve more security issues, reduce the mean time to repair security issues, etc.

Best Practice: Adopt DevSecOps practices by including security tools in your CI/CD pipeline. Automate security scans, vulnerability assessments, and code reviews so that security is built into every stage of the development process. Tools like SonarQube, Snyk, and Aqua Security will help identify vulnerabilities in code and container images before they’re deployed.

Example: A DevSecOps development team integrates automated security checks into their CI/CD pipeline. It will scan codes for vulnerabilities before pushing the changes into production. This is an opportunity to discuss and fix security bugs proactively and help reduce vulnerability injection into their cloud infrastructure.

Network Segmentation: Cloud Security Best Practice

A zero-trust approach to cloud networking should be applied in the protection of every single part of your infrastructure. Network security policies should be applied to each component. A cloud network can be segmented to minimally target the size of the breach through containing your attack surface.

Best Practice:  To isolate sensitive resources using VPCs, network segmentation, and firewalls. Implement intrusion detection and prevention systems for constant monitoring of network traffic to look for suspicious activity. Use VPNs or Secure Access Service Edge (SASE) to strictly control access to your cloud resources.

Example: Companies VPC to separate the front-end services from back-end services. Having applied strict firewall rules, and segmented the network, it prevents lateral movement in case a breach will have occurred.

Back up data as well as create a disaster recovery plan

No security strategy is complete without an obvious disaster recovery plan. If regular backups were done and a clear plan of how to recover existed in case of system failure, natural disaster, or security breach, then this could be turned into a very feasible issue, with minimum downtime and intact data integrity.

Best Practice: Backup critical data at regular intervals and then test your disaster recovery plan so that in the event of a disaster, your plan should be executable. Your backup should always be located at geographically different places for increased robustness.

Example: A global media company using Azure designs a geo-redundant backup strategy wherein copies of their data are stored in multiple regions for rapid recovery in case of regional outage or cyber attack.

Conclusion

An overarching goal in securing the cloud infrastructure would be to have an all-rounded approach that would involve best practices in identity management, data encryption, continuous monitoring, and automation of various security processes. All these can be achieved through following such strategies with reduced risks and increasing minimal chances of breaches and ensuring long-term security in the cloud environment.

More Blogs: Mastering DevOps Monitoring and Logging: Proven Strategies for 2024

Building Effective CI/CD Pipelines: A Step-by-Step Guide

Step-by-step CI/CD pipelines setup for software development to automate testing, build, and deployment processes in 2024

Introduction

CI/CD Pipelines play a crucial role in automating development workflows, improving code quality, and speeding up releases. In the world of software development, speed and efficiency bring about competitiveness. CI/CD Pipelines Setup pipelines are fundamental tools that assist the development process in becoming more linear, aiding in the automation of tests, and making it faster and more reliable to release a product in the market. A CI/CD Pipelines Setup can reduce manual processes significantly, improve code quality, and reduce deployment errors. This step-by-step guide will help you through setting up a CI/CD Pipelines Setup for your development team.

CI/CD Pipelines Setup: Step-by-Step

Understand the Basics of CI/CD: What are CI/CD? Before introducing a CI/CD pipelines, one should know what CI and CD are. Continuous Integration is the practice of integrating code changes into a shared repository several times a day. Each of those merges is automatically driven against all of the relevant test suites to automatically test and catch mistakes early in the cycle. Continuous Delivery extends CI by automating the work of delivering software so that changes can be delivered to production or staging environments seamlessly.

With CI/CD pipelines, bugs and issues are caught early in the development cycle, testing is streamlined, and new features get to market more quickly with less risk.

Choose the Correct CI/CD Tools: It would be tough to build the right CI/CD pipelines unless the right tools are chosen. Choosing the right tools is essential for designing efficient CI/CD Pipelines that support scalability and automation. Many CI/CD tools are available with various features of all of them. Some of the most used CI/CD tools are as follows:

  1. Jenkins: A highly customizable open source automation server.
  2. GitLab CI: An integrated CI/CD tool that communicates directly with your GitLab repositories.
  3. CircleCI: A cloud-based CI/CD tool known mainly for its quick and flexible way of testing.
  4. Travis CI: Known to be a super popular CI service because of the ease of integration with GitHub.

When you choose any of them, factors like ease of integration with your current environment, scalability, and support for programming languages and the platforms you want to use should come to play.

Setting Up Version Control: A CI/CD pipelines cannot be possible without a version control system. Version control enables developers to track, collaborate, and keep records of every modification they make on the code. Git is the most widely used version control system for CI/CD pipelines.

First, make sure that your development team uses Git or any other version control system to maintain the codebase. Implement branching strategies, such as GitFlow or trunk-based development, to ensure tidy and well-structured code. You will find these branches useful while defining how the CI/CD pipelines must handle feature developments, bug fixes, and deployments.

Configure Automated Builds: Installation of the version control system is followed by implementing automated builds. Automated builds make sure that whenever new code changes are pushed into the repository, it gets compiled and packaged. The CI tool you will choose-most probably among Jenkins or GitLab CI-will automatically trigger each build whenever new code is committed to the version control system.
At this point, specify what kinds of branches should provoke building (for example, primarily main, dev or feature branches). It ensures that any failures in compilations are caught early. Thus, the chances of later-stage failures are small.

Implement Automated Testing: Automated testing is a fundamental part of CI/CD pipelines. This is because it ensures that the changes to new code do not break any functionality you have before, thus catching all the bugs before hitting the production environment. There are several forms of automated testing including;

  1. Unit Testing: These tests verify individual functions or modules of your code.
  2. Integration Testing:Tests that ensure that different modules or services work together as you had expected.
  3. End-to-End Testing: Simulates real-user interactions to verify the entire application’s behavior.

Integrate these tests into your CI pipelines so that it runs automatically after every build. If any tests fail, the pipelines must notify the development team right away so the developers can correct the issue before moving forward.

Configure Continuous Delivery (CD): After that, configure Continuous Delivery. CD automates the deployment process, so now your application can be safely deployed to any production (or staging) environments at will. This generally means defining deployment pipelines that define where your application should be deployed and under what conditions.
Use Docker and Kubernetes to deploy the containers for your application. This makes deployment anywhere smooth since Docker ensures an application behaves exactly the same regardless of where it is deployed, while Kubernetes automates the management of containerized applications.

Monitoring and Maintaining the Pipelines: Once your CI/CD pipelines is up and running, it’s vital to monitor it constantly. This will highlight areas of bottlenecks, optimize times for builds, and ensure that your pipelines is running smoothly. Many CI/CD tools provide in-built monitoring or integrate third-party monitoring tools like Datadog or Prometheus.
Apart from that, routine pipelines maintenance will ensure your CI/CD processes stay fresh and updated, updating dependencies, refining test coverage, and adjustments of deployment strategies as the project evolves.

Rollback and Recovery Strategies: No CI/CD pipelines is flawless, and sometimes a deployment can cause unexpected issues in the production environment. That is where rollback and recovery strategies are important to be practiced. Automated rollback ensures that in case of a failed deployment or one with extreme bugs, the pipelines can return to a previous version of the software.
Most CI/CD tools will support rolling back by using some form of version control, so it is easy to switch back to a stable version. Also, make sure you have backups and proper disaster recovery in case major failures occur.

Creating a Culture for Continuous Improvement: A good CI/CD pipelines is never static. Encourage the development team to embrace an environment of continuous improvement. Review and optimize your CI/CD pipelines regularly to make it more efficient, to lower build times, and to increase the number of tests that are run. Regular retrospectives can go a long way in helping teams identify pain points and implement new practices to improve the overall development workflow.

Secure the Pipeline: Every step of the pipeline should have security integration into the CI/CD. Some examples include static code analysis, vulnerability scanning, among others, which will be part of the best practice for ensuring your code is secure at every point of development. This may spot vulnerabilities and will keep on enabling you to address them before they pose a risk when integrations are done within the pipeline.

Conclusion

A CI/CD pipelines is one of the best implementations to streamline your development processes in terms of driving collaboration and delivering software faster. It is achieved through selecting the right tools, setting up version control, automating builds and tests, and security for creating an efficient and reliable CI/CD pipelines. Adopting these best practices will give the team an edge to be competitive in a fast-developing landscape that emphasizes delivering value at all speeds.

More Blogs: CI/CD Pipeline Setup: Step-by-Step

10 Ways to Optimize Cloud Costs Without Sacrificing Performance

Cloud infrastructure dashboard used to optimize cloud costs effectively

Introduction

Optimize Cloud Costs is essential for businesses that want to control cloud spending while maintaining high performance. Flexibility and scalability characterize cloud computing, but the management of costs can be a real challenge. Cloud computing services offer businesses robust infrastructure, but expenses can spiral out of control quickly when not properly optimized. However, it is possible to optimize cloud costs without compromising performance. Here are 10 strategies that can be used to better manage your cloud spending while keeping performance levels high.

Right Sizing Your Resources

Cloud providers normally enable users to choose the size of their virtual machines or storage. As you avoid over-provisioning when you go through your workload requirements carefully, you will have an appropriate set of resources and thus save unnecessary cost.

Monitor Unused Resources with CloudWatch

For periodic usage – e.g. for hosting a web application constantly, you can benefit from the reserved instances. The latter involves contracts usually spanning from one to three years; thus, you save considerably compared with a pay-as-you-go pricing model.

Apply Auto-scaling

Auto-scaling gives you an opportunity to scale up or down the number of virtual machines based on your system’s needs at different times of the day. You only pay for those resources when they are needed by your system, so during periods of lower usage, you are not wasting money because your configuration happens to be too big.

Scheduling Non-Production Resources

Development, test, or staging environments are not required to function 24×7. Schedule your non-production resources to automatically turn off during after-work hours (like nights and weekends) in order to save on unnecessary costs while keeping the effects on productivity low.

Make Use of Spot Instances for Flexible Workloads

Spot Instances, though cheaper than On-Demand Instances, can be interrupted when their capacity is needed elsewhere by the provider. These are a cost-efficient way to optimize your spending for flexibility or non-critical workloads.

Monitor and Manage Idle Resources

Unused resources like idle virtual machines or an over-provisioned storage quickly inflate the cost. Regularly monitor and terminate idle resources to ensure you are only paying for what is actively used.

Leverage Cloud Cost Management Tools

Most cloud providers offer cost management tools that let you monitor expenditure and set budgets. These allow you to gain insights over resource usage, thereby helping in taking informed decisions regarding where cost can be cut or more allocated for performance.

Optimize Data Storage

Not all data needs to reside in high-performance tiers. Moving infrequently accessed data to cold storage or archival solutions means you can get rid of storage costs dramatically while still providing the access you need.

Leverage Serverless Architectures

This is serverless computing, running your code without a provisioning or management of servers. You pay based on compute time of your application and which is cost-effective when applied to event-driven workloads with no loss of performance.

Review and Optimize Cloud Usage

Cloud environments are in constant flux so your usage behavior is guaranteed to change over time. Periodic review of cloud usage ensures that the following are up to date and in step with current needs: your cost-optimisation strategy not wasting costs without sacrificing performance.

Conclusion

By implementing these strategies, organizations can achieve a balance between cost-efficiency and high performance. Regular monitoring, proper resource allocation, and leveraging the right tools allow you to optimize cloud costs continuously. Following these 10 steps ensures that your cloud environment remains scalable, flexible, and cost-effective, ultimately maximizing the return on your cloud investments.

More Blogs: Maximize Brand Impact: 7 Tactics for Leveraging Social Media

  • Copyright © 2026 codelynks.com. All rights reserved.

  • Terms of Use | Privacy Policy